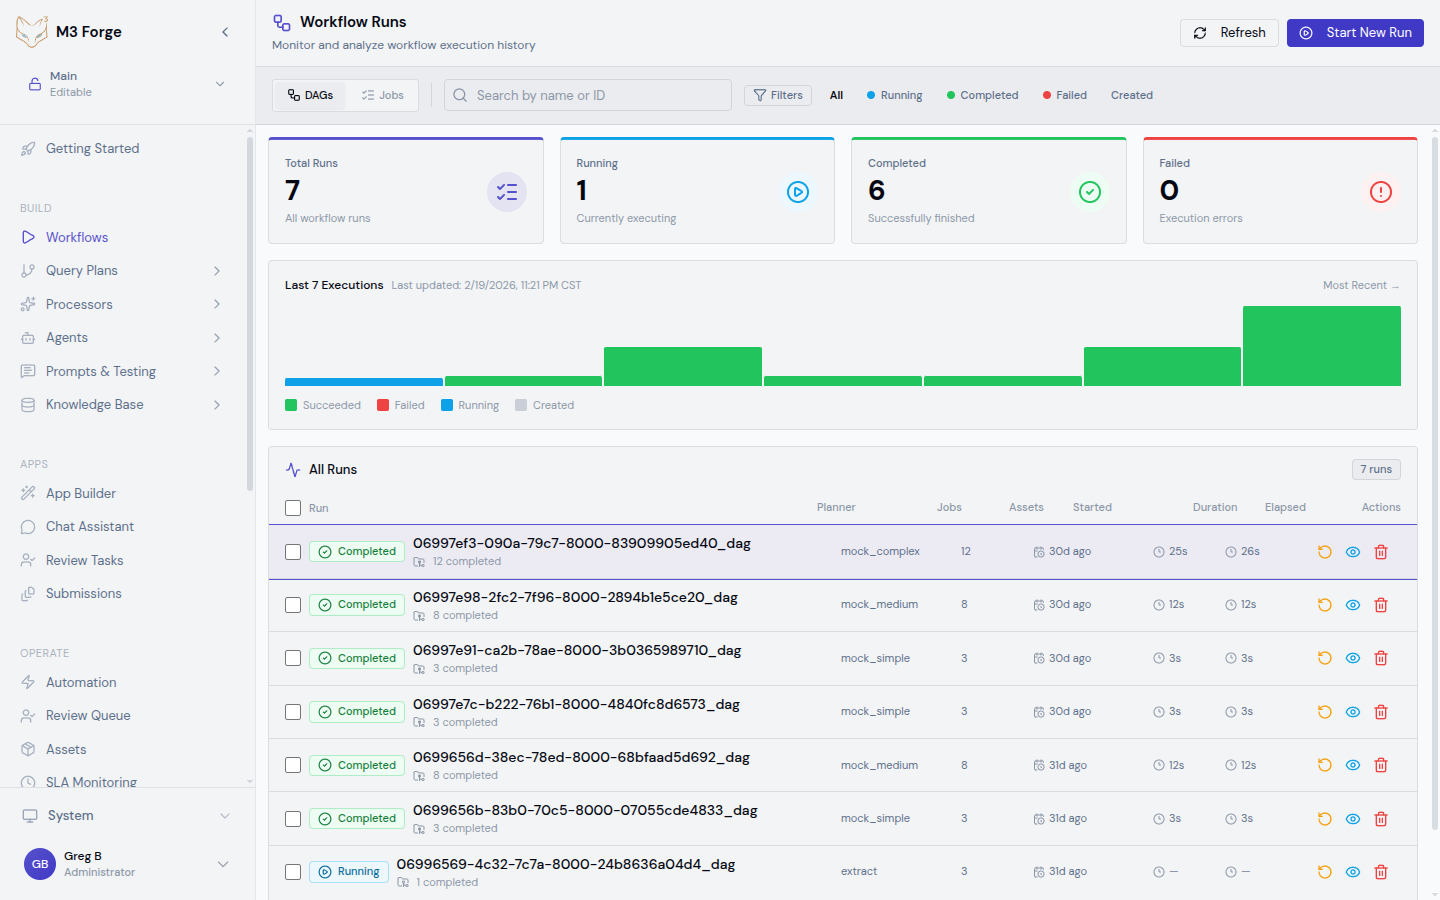
Runs
Monitor workflow execution status, track jobs, and analyze performance.
Runs View
The Runs view provides real-time monitoring of all workflow executions. Access it via:
- OPERATE → Runs in the sidebar
- Or click View Runs from any workflow editor
Run States
Each run progresses through states tracked in the marie_scheduler.jobs table:
| State | Description | Next States |
|---|---|---|
| created | Job queued, not started | active, failed |
| active | Currently executing | completed, failed, terminated |
| completed | Finished successfully | - |
| failed | Encountered error | - |
| terminated | Manually stopped | - |
State transitions are immutable and logged with timestamps.
Filtering Runs
Use the filter bar to narrow down runs:
By Status
- All - Show all runs regardless of status
- Running - Only active executions
- Completed - Successfully finished runs
- Failed - Runs with errors
- Terminated - Manually stopped runs
By Workflow
Select a specific workflow from the dropdown to show only its runs.
By Date Range
Click the date picker to filter runs within a time window:
- Last hour - Recent executions
- Last 24 hours - Today’s runs
- Last 7 days - This week
- Last 30 days - This month
- Custom range - Specify start and end dates
By User
Filter runs by the user who triggered them (for manual runs).
Run Details
Click a run to open the detailed view:
Overview
- Run ID - Unique identifier
- Workflow - Name and version
- Status - Current state with color indicator
- Started - Timestamp when execution began
- Duration - Total execution time (or elapsed time for active runs)
- Triggered by - User or automation trigger
- Cost - Total API cost (if LLM nodes used)
- Tokens - Total tokens consumed
Timeline View
Visual timeline showing:
- Node execution order - Left-to-right chronological flow
- Parallel branches - Nodes that ran concurrently
- Duration per node - Width proportional to execution time
- Node status - Green (success), red (failed), yellow (skipped)
Click a node in the timeline to view its details.
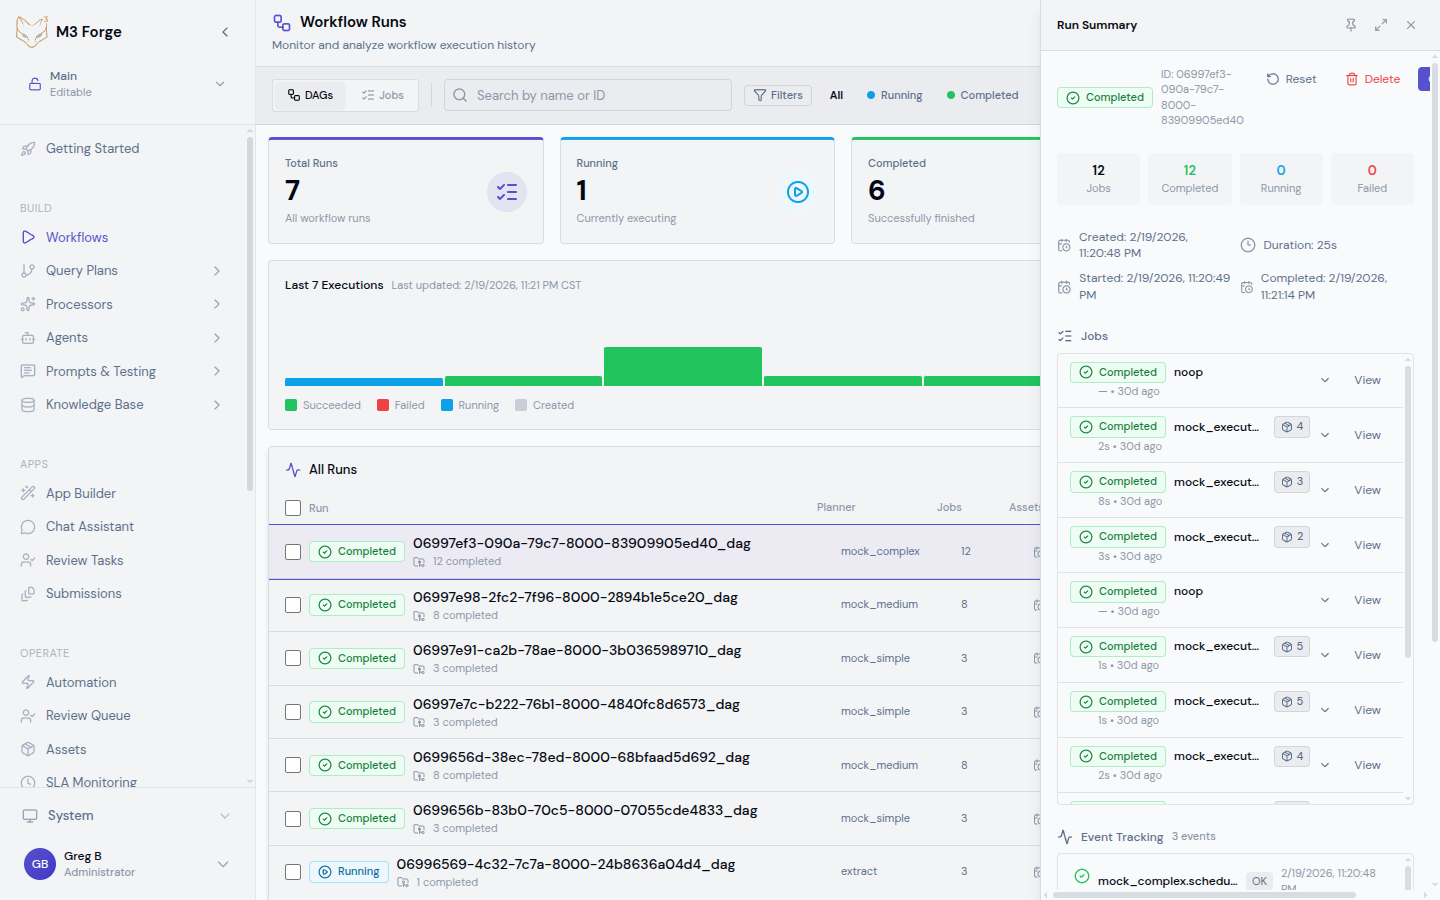
Job Tracking
Detailed job information for the run:
{
  "job_id": "job_abc123",
  "dag_id": "invoice_processing_v3",
  "state": "completed",
  "created_at": "2026-03-19T10:23:45Z",
  "started_at": "2026-03-19T10:23:47Z",
  "completed_at": "2026-03-19T10:24:12Z",
  "total_duration_ms": 25000,
  "ref_id": "user_xyz",
  "ref_type": "user"
}
Execution History
Chronological log of all events during the run:
- Node started - Timestamp and input data
- Node completed - Timestamp and output data
- Node failed - Error message and stack trace
- Path selected - For conditional routing nodes
- Human action - For HITL nodes (approve/reject/correct)
Each event includes a timestamp and is stored in the event_tracking table.
Real-Time Updates
The Runs view uses Server-Sent Events (SSE) for real-time updates:
- Status changes - Run transitions to new state
- Log entries - New execution log lines
- Node completions - Individual node finishes
- Cost updates - Token usage and API cost increments
Updates stream from /api/sse-logs/:runId endpoint and appear instantly without page refresh.
Real-time streaming is powered by tRPC subscriptions. If connection is lost, the UI automatically reconnects and backfills missed events.
Bulk Operations
Select multiple runs using checkboxes to perform bulk actions:
Retry Failed Runs
Rerun selected failed runs with the same input:
- Filter to Failed status
- Select runs to retry
- Click Retry Selected
- Confirm in dialog
New runs are created with fresh job IDs but reference the original run.
Terminate Active Runs
Stop long-running or stuck executions:
- Filter to Running status
- Select runs to terminate
- Click Terminate Selected
- Confirm in dialog
Runs transition to terminated state immediately. In-flight nodes complete their current operation before stopping.
Export Run Data
Export run metadata and logs as JSON or CSV:
- Select runs to export
- Click Export dropdown
- Choose format (JSON/CSV)
- Download file
Useful for external analysis or compliance reporting.
Delete Runs
Permanently remove runs and their logs:
- Select runs to delete
- Click Delete Selected
- Confirm in dialog (irreversible)
Deleting runs removes all execution history and logs. This action cannot be undone. Consider exporting data first.
Performance Analysis
Duration Breakdown
The timeline view shows duration per node. Identify bottlenecks:
- Slow nodes - Nodes taking disproportionate time
- Parallel inefficiencies - Opportunities for parallelization
- Idle time - Gaps between node executions (scheduling overhead)
Cost Analysis
For workflows with LLM nodes, view cost breakdown:
- Total cost - Across all nodes in the run
- Cost per node - Individual LLM invocation costs
- Token usage - Input/output tokens per node
- Most expensive nodes - Identify cost hotspots
Use this data to optimize prompts and model selection.
Failure Patterns
Filter to failed runs and analyze common issues:
- Error messages - Group by error type
- Failed nodes - Identify problematic nodes
- Retry success rate - How often retries succeed
- Time to failure - How far into execution failures occur
Use insights to improve error handling and validation.
Run Context
Each run includes full execution context accessible in logs:
{
  "run_id": "run_abc123",
  "workflow_id": "invoice_processing",
  "workflow_version": 3,
  "input_data": {
    "document": "...",
    "options": {}
  },
  "nodes": {
    "extract_text": {
      "started_at": "2026-03-19T10:23:50Z",
      "completed_at": "2026-03-19T10:23:53Z",
      "input": { "source": "$.data.document" },
      "output": { "text": "..." },
      "metadata": {
        "duration_ms": 3000,
        "executor": "ocr_executor"
      }
    }
  }
}
Access via View Context button in run details.
Integration with Automation
Runs can be triggered by:
- Manual execution - Click Run in workflow editor
- API calls - tRPC
workflows.executeprocedure - Scheduled triggers - Cron-based execution (see Triggers)
- Event triggers - Webhook or internal events
- Automation flows - Via automation builder (see Automation)
All trigger sources are tracked in run metadata.
Archival and Retention
Run data is stored in PostgreSQL with configurable retention:
- Active runs - Retained indefinitely
- Completed runs - Default: 90 days
- Failed runs - Default: 180 days (longer for debugging)
- Terminated runs - Default: 30 days
Configure retention in MANAGE → Settings → Runs.
Archived runs are compressed and moved to cold storage (S3-compatible). Metadata remains queryable but full logs require restore operation.
API Access
Access run data programmatically via tRPC:
// Get recent runs
const runs = await trpc.runs.list.query({
  limit: 50,
  status: 'completed',
  workflow_id: 'invoice_processing'
});

// Get run details
const run = await trpc.runs.get.query({ id: 'run_abc123' });

// Get run logs (streamed)
const subscription = trpc.runs.streamLogs.subscribe(
  { runId: 'run_abc123' },
  {
    onData: (logEntry) => console.log(logEntry),
    onError: (err) => console.error(err)
  }
);
Troubleshooting
Run Stuck in “Active” State
If a run appears stuck:
- Check the timeline to see which node is running
- View node logs for progress indication
- If truly stuck, terminate the run manually
- File a bug report with run ID
Common causes: network timeouts, executor crashes, database deadlocks.
Missing Logs
If logs are incomplete:
- Check SSE connection status (red indicator in top-right)
- Refresh page to reconnect SSE stream
- Export run data and check log completeness
- Contact support if logs are genuinely lost
Logs are written to database synchronously so loss is rare.
High Failure Rate
If many runs fail:
- Filter to failed runs and group by error type
- Check if failures cluster around specific nodes
- Review recent changes to failing workflows
- Check Marie-AI backend health in INFRASTRUCTURE → Services
Slow Performance
If runs are slower than expected:
- Review timeline for bottleneck nodes
- Check if parallel branches are actually parallelized
- Verify Marie-AI backend has sufficient resources
- Consider splitting workflow into smaller sub-workflows
Related Resources
- Building Workflows - Create workflows
- Triggers - Automate execution
- Nodes - Available node types
- Automation - High-level automation builder