Automation
Event-driven workflow execution with triggers, webhooks, scheduling, and sensor-based monitoring.
What is Automation?
Automation in M3 Forge enables workflows to run automatically in response to events, schedules, or external triggers. Instead of manual execution, workflows activate based on:
- Time-based schedules (cron expressions, recurring intervals)
- Webhooks (HTTP callbacks from external systems)
- Event streams (database changes, message queues)
- Data arrival (new files in storage, queue messages)
- Workflow completion (chain workflows based on run status)
- Polling (periodic checks of external APIs)
This event-driven model eliminates manual intervention and ensures timely processing.
Architecture
Automation follows a sensor-based architecture inspired by Dagster’s execution model:
Key Components
Sensors:
- Lightweight monitors that check for conditions
- Run on configurable intervals (minimum 30 seconds)
- Maintain cursor state for incremental processing
- Track success/failure counts and last tick timestamp
Triggers:
- Configuration objects defining what to monitor and how to respond
- Can be global (standalone) or embedded in workflow query plans
- Support multiple trigger types with type-specific parameters
Ticks:
- Individual sensor evaluation runs
- Record timestamp, status (success/skip/fail), and cursor position
- Visualized in timeline UI for monitoring
Run Requests:
- Generated when sensor conditions are met
- Contains workflow ID, input payload, and metadata
- Queued for execution by the scheduler
Sensor Model
Global Sensors
Standalone sensors created in the Automation page:
- Scope: System-wide, can trigger any workflow
- Lifecycle: Independent of workflow lifecycle
- Management: Create, edit, enable/disable, delete via UI
- Use case: Reusable triggers (daily report generation, periodic cleanup)
Plan-Embedded Triggers
Triggers defined within workflow START nodes:
- Scope: Tied to specific workflow
- Lifecycle: Deleted when workflow is deleted
- Management: Edit via workflow canvas
- Use case: Workflow-specific activation (webhook endpoint per workflow)
Plan-embedded triggers are the recommended pattern for most workflows. Use global sensors for cross-cutting concerns like monitoring or scheduled maintenance.
Trigger Types
M3 Forge supports seven trigger types, each optimized for different event sources.
Manual
User-initiated execution via UI or API:
{
  "type": "manual",
  "config": {}
}
No automatic execution. Workflow runs when user clicks “Run” or calls the API.
Use cases:
- Ad-hoc processing
- Testing and debugging
- Interactive applications
Schedule
Time-based execution with cron expressions:
{
  "type": "schedule",
  "config": {
    "cron": "0 9 * * 1-5",
    "timezone": "America/New_York"
  }
}
Use cases:
- Daily reports (generate PDF every morning)
- Periodic cleanup (delete old logs weekly)
- Batch processing (nightly data sync)
See Scheduling for cron syntax and examples.
Webhook
HTTP endpoint that triggers workflow on POST requests:
{
  "type": "webhook",
  "config": {
    "auth_type": "bearer_token",
    "allowed_ips": ["203.0.113.0/24"]
  }
}
Each webhook trigger generates a unique URL:
https://your-instance/api/webhooks/wh_abc123xyzUse cases:
- GitHub push notifications (trigger deployment on commit)
- Payment processor callbacks (process order on payment)
- Form submissions (start workflow on user signup)
See Webhooks for authentication and payload formats.
Polling
Periodic checks of external APIs or endpoints:
{
  "type": "polling",
  "config": {
    "url": "https://api.example.com/tasks",
    "interval_seconds": 300,
    "http_method": "GET",
    "headers": {
      "Authorization": "Bearer TOKEN"
    }
  }
}
Sensor polls endpoint every interval_seconds and triggers workflow if response changes.
Use cases:
- Monitor external API for new records
- Check S3 bucket for new files
- Poll database for pending jobs
Event
Subscribe to internal event streams (database changes, message queues):
{
  "type": "event",
  "config": {
    "event_type": "document.uploaded",
    "filter": {
      "tenant_id": "customer-123"
    }
  }
}
Event sources:
- Database triggers (PostgreSQL LISTEN/NOTIFY)
- RabbitMQ queues
- Redis pub/sub channels
- Kafka topics
Use cases:
- Process new documents on upload
- React to workflow state changes
- Handle user actions (file delete, approval)
Run Status
Trigger workflow based on another workflow’s completion:
{
  "type": "run_status",
  "config": {
    "watched_workflow_id": "extract-pipeline",
    "statuses": ["completed"],
    "propagate_failure": true
  }
}
Use cases:
- Workflow chaining (ETL pipeline stages)
- Conditional branching (run QA on successful extraction)
- Cleanup workflows (delete temp files after completion)
Data Sink
Monitor data sinks (queues, storage) for new items:
{
  "type": "data_sink",
  "config": {
    "sink_type": "s3",
    "bucket": "incoming-documents",
    "prefix": "uploads/",
    "poll_interval_seconds": 60
  }
}
Supported sinks:
- S3/MinIO buckets
- Azure Blob Storage
- Google Cloud Storage
- RabbitMQ queues
- Redis lists
Use cases:
- Process files as they arrive in cloud storage
- Consume messages from queues
- Trigger on database inserts
Status Lifecycle
Sensors transition through states:
| State | Description | Monitoring |
|---|---|---|
| Inactive | Sensor exists but does not evaluate | No ticks generated |
| Active | Sensor running on schedule | Ticks appear in timeline |
| Paused | Temporarily disabled (preserves state) | No new ticks, history retained |
| Error | Last tick failed (sensor continues) | Alert icon, error message visible |
State Transitions
- Create →
inactive(default for global sensors) - Activate →
active(starts tick evaluation) - Pause →
paused(stops ticks, preserves cursor) - Resume →
active(restarts from paused state) - Delete → Removed (cannot be undone)
Plan-embedded triggers are automatically active when workflow is deployed.
Execution History
Each sensor tracks:
- Last Tick Timestamp - Most recent evaluation time
- Cursor - Incremental processing position (e.g., last processed event ID)
- Failure Count - Consecutive failures (resets on success)
- Last Error - Error message from most recent failure
- Recent Ticks - Summary of success/skip/fail counts (last 100 ticks)
Tick Timeline
The timeline visualization shows:
- Green bars - Successful ticks (workflow triggered)
- Gray bars - Skipped ticks (no condition met)
- Red bars - Failed ticks (error during evaluation)
- Gaps - Sensor was paused or inactive
Hover over bars to see tick details (timestamp, cursor, error message).
Run Correlation
Click a successful tick to view the triggered workflow run:
- Run ID and status
- Input payload generated by sensor
- Execution logs and trace
- Success/failure status
This enables debugging sensor logic and understanding workflow inputs.
Configuration
Minimum Interval
Sensors have a minimum evaluation interval (default: 30 seconds) to prevent excessive polling:
{
  "minimum_interval_seconds": 30
}
For schedule triggers, this ensures cron expressions don’t fire more frequently than the interval.
Guidelines:
- Real-time events (webhooks, event streams) - No interval needed (event-driven)
- Near real-time (polling APIs) - 30-60 seconds
- Batch processing (hourly/daily) - Match cron schedule
Cursor Management
Sensors maintain cursor state for incremental processing:
{
  "cursor": "2024-03-19T10:30:00Z"
}
Examples:
- Event stream - Last processed event ID
- Polling - Last seen timestamp or ETag
- Data sink - Last file modification time
Cursors prevent duplicate processing when sensor restarts or resumes.
Failure Handling
Configure retry behavior:
{
  "max_failures": 3,
  "failure_action": "pause"
}
Actions on failure threshold:
- continue - Log error, keep running
- pause - Disable sensor, require manual resume
- alert - Send notification, keep running
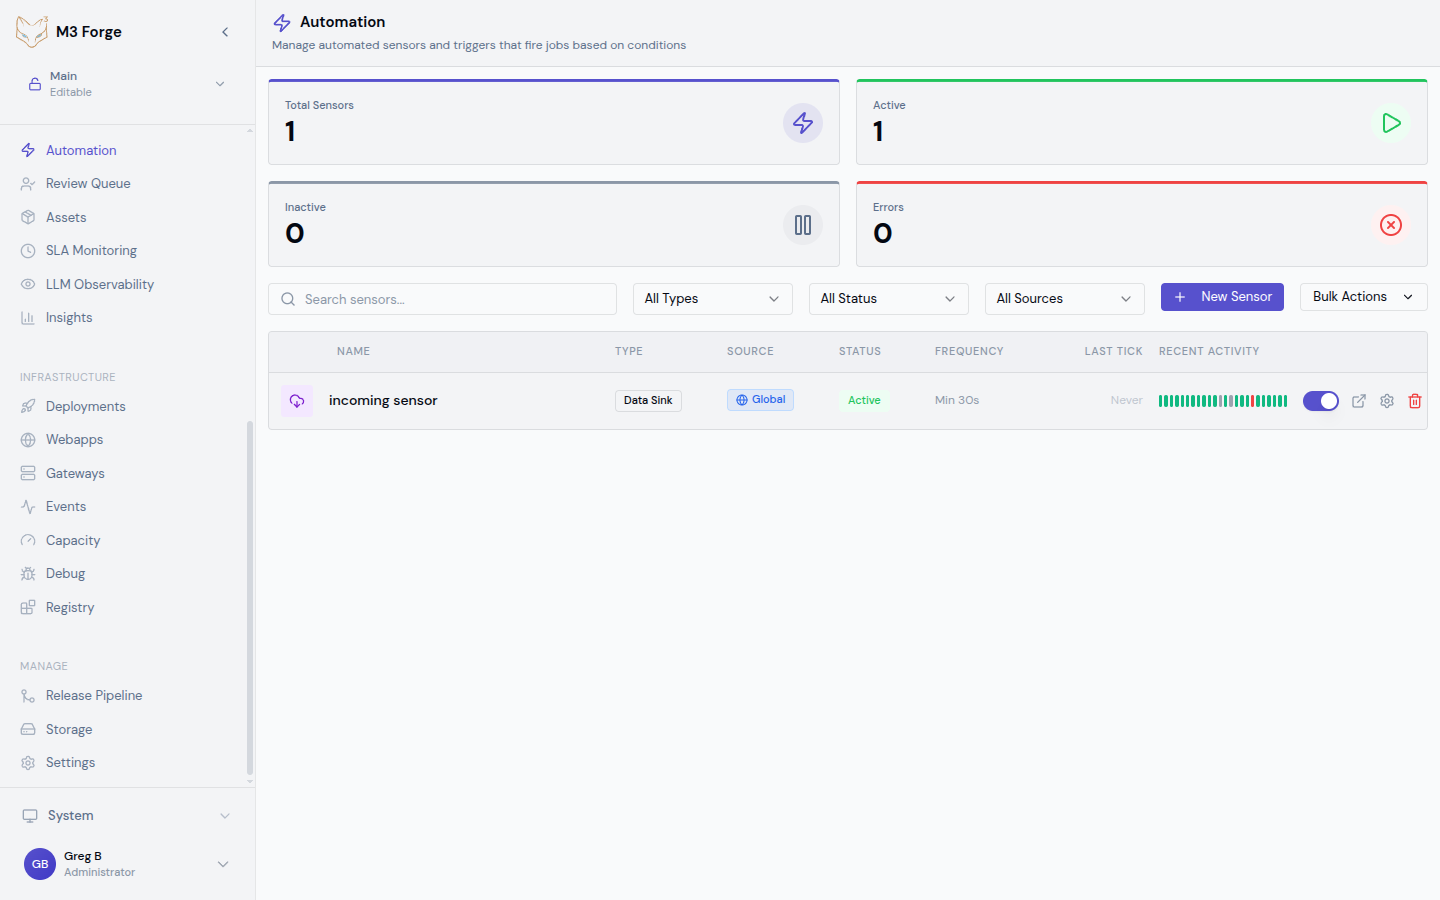
Monitoring Dashboard
The Automation page provides:
- Sensor List - All sensors with status, type, last tick
- Metrics Cards - Total sensors, active count, error count
- Filters - Search by name, filter by type/status/source
- Tick Timeline - Visual history of sensor evaluations
- Execution Count - Total workflow runs triggered
Metrics
Top-level dashboard cards show:
- Total Sensors - All configured sensors
- Active - Currently evaluating sensors
- Inactive - Disabled or draft sensors
- Errors - Sensors in error state (requires attention)
Alerts
Set up alerts for:
- Sensor failures exceeding threshold
- No successful ticks in expected time window
- Workflow runs triggered by sensor failing
- Cursor not advancing (stuck sensor)
Monitor the error count metric closely. Persistent failures indicate configuration issues, API changes, or infrastructure problems requiring immediate attention.
Getting Started
Triggers
Configure all seven trigger types with detailed examples and best practices.
Webhooks
Set up webhook endpoints with authentication, payload handling, and debugging.
Scheduling
Master cron expressions, timezone handling, and recurring schedule patterns.
Integration Patterns
Workflow START Node
Embed triggers directly in workflows:
- Open workflow in canvas editor
- Select START node
- Configure trigger in node properties panel
- Deploy workflow to activate trigger
The trigger lifecycle is managed automatically with the workflow.
Global Automation Rules
Create reusable sensors in Automation page:
- Click “New Sensor”
- Select trigger type
- Configure parameters and target workflow
- Save and activate
Global sensors persist independently of workflows.
API Management
Manage sensors programmatically:
// Create sensor
const sensor = await trpc.triggers.create.mutate({
  name: 'Daily Report Generator',
  triggerType: 'schedule',
  config: { cron: '0 9 * * *' },
  targetWorkflowId: 'report-workflow',
});

// Activate sensor
await trpc.triggers.activate.mutate({ id: sensor.id });

// Pause sensor
await trpc.triggers.pause.mutate({ id: sensor.id });
Best Practices
Sensor Design
- Single Responsibility - One sensor per event source
- Idempotent Workflows - Ensure workflows handle duplicate triggers gracefully
- Cursor Checkpointing - Update cursor only after successful processing
- Error Handling - Configure appropriate failure actions
Performance
- Batch When Possible - Process multiple items per trigger (reduce overhead)
- Rate Limiting - Set appropriate minimum intervals to avoid overwhelming systems
- Async Processing - Use long-running workflows for heavy computations
Security
- Webhook Authentication - Always use bearer tokens or HMAC signatures
- IP Allowlisting - Restrict webhook sources to known IPs
- Secret Management - Store API keys in environment variables, not sensor config
- Least Privilege - Grant sensors minimal permissions needed
Next Steps
- Configure trigger types for your workflows
- Set up webhook endpoints for external integrations
- Master scheduling patterns for recurring tasks
- Monitor automation health in the runs dashboard