Capacity
Real-time capacity monitoring dashboard for tracking extraction engine resource utilization across all connected gateways.
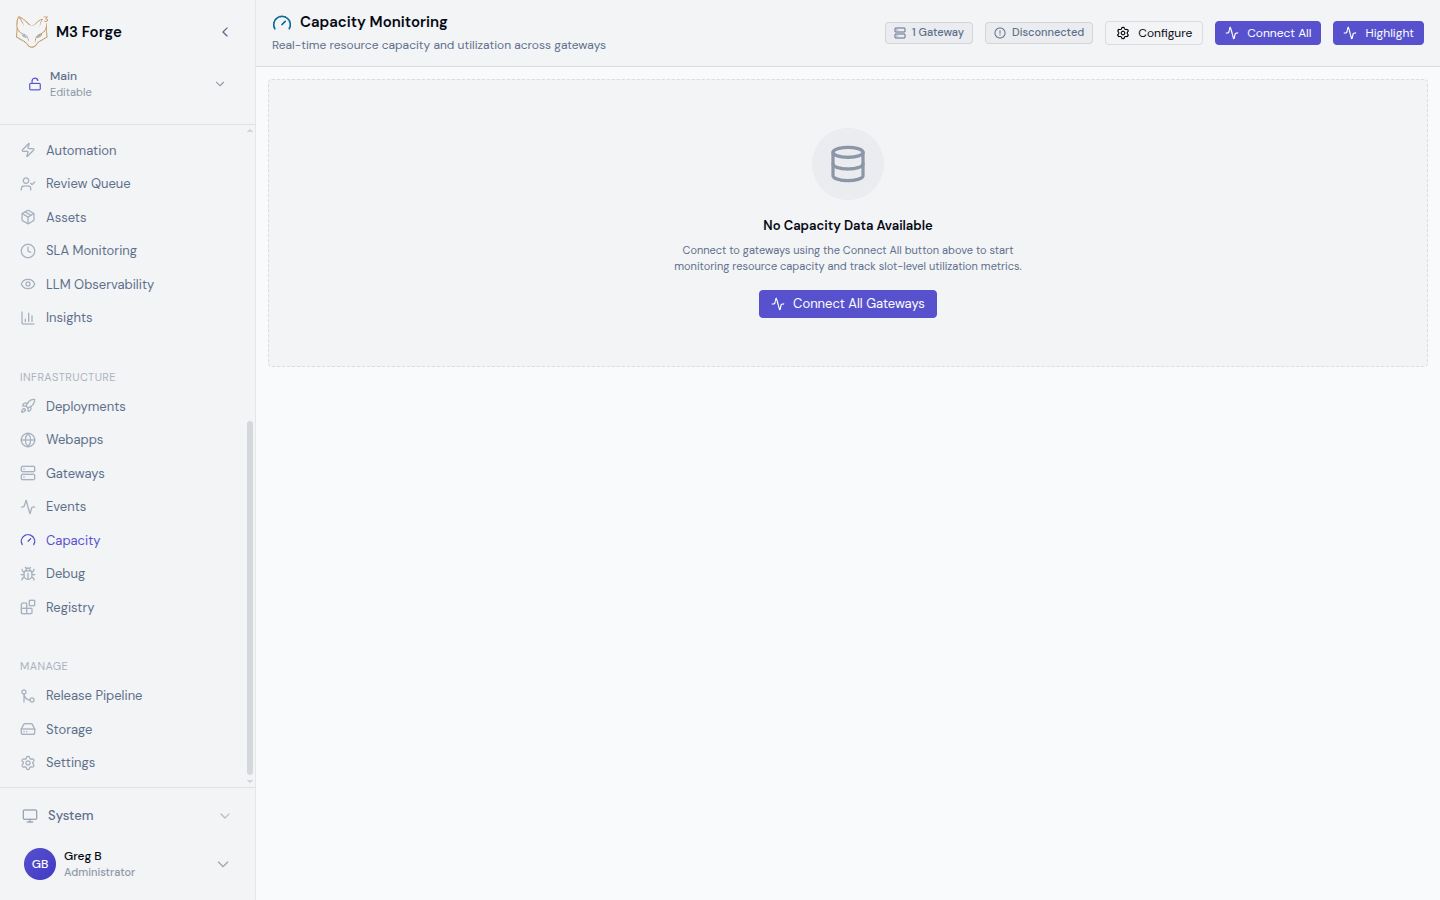
Overview
The Capacity view provides live monitoring of extraction engine resources, showing how capacity slots are allocated and consumed across your infrastructure. This enables proactive capacity planning and prevents resource exhaustion.
Key capabilities:
- Real-time capacity tracking across multiple gateways
- Per-slot utilization metrics with visual indicators
- Change detection with animated highlighting
- Multi-gateway connection management
- Auto-scrolling live updates
Capacity data updates in real-time via tRPC SSE subscriptions listening for RESOURCE_EXECUTOR_UPDATED engine events.
Gateway Status Cards
At the top of the dashboard, status cards display aggregate metrics for all connected gateways:
- Connected Gateways: Total number of active gateway connections
- Total Capacity: Sum of all capacity slots across all gateways
- Utilization: Overall percentage of capacity in use
- Health: Aggregate health status (healthy/degraded/critical)
These cards provide an at-a-glance view of your entire extraction infrastructure.
Per-Gateway Summary
Each connected gateway displays a summary panel showing:
| Metric | Description |
|---|---|
| Total Capacity | Maximum concurrent operations this gateway can handle |
| Used | Currently occupied slots (color-coded by utilization) |
| Available | Free slots ready for new operations |
| Holders | Number of active consumers using capacity |
Utilization Color Coding
Capacity usage is color-coded to quickly identify potential bottlenecks:
- Green (<50%): Healthy utilization with ample headroom
- Yellow (50-80%): Moderate utilization, monitor for trends
- Red (>80%): High utilization, consider scaling
Sustained red utilization may indicate the need to add gateway capacity or optimize extraction workloads.
Capacity Slots Table
The detailed slots table shows granular capacity allocation:
| Column | Description |
|---|---|
| Slot Name | Identifier for this capacity pool (e.g., extraction, ocr, classification) |
| Capacity | Total configured slots for this resource type |
| Target | Desired capacity (may differ from current during scaling) |
| Used | Currently occupied slots |
| Available | Free slots (Capacity - Used) |
| Holders | Number of consumers holding capacity |
| Utilization % | Usage percentage with color coding |
| Notes | Additional context or warnings |
Understanding Slots
Capacity slots represent execution units for different operation types. Common slot types:
- Extraction: Document parsing and text extraction capacity
- OCR: Optical character recognition processing capacity
- Classification: Document classification capacity
- Validation: Rule validation capacity
- Processing: General processing capacity
Each slot type can be independently configured and monitored.
Change Detection
The dashboard highlights changed values in real-time to draw attention to capacity shifts:
- Changed values pulse with a subtle animation
- Highlights automatically fade after a few seconds
- Toggle the “Show Highlights” button to enable/disable change detection
Change detection is particularly useful during load testing or when investigating capacity issues.
Multi-Gateway Monitoring
The Capacity view supports monitoring multiple gateways simultaneously:
Connect to Gateways
Use the “Connect All” button to establish connections to all configured gateways, or connect to individual gateways via their control panels.
View Consolidated Data
Each gateway’s capacity is displayed in its own section, allowing side-by-side comparison of utilization across your infrastructure.
Manage Connections
Disconnect from specific gateways or all gateways using the gateway control panel or “Disconnect All” button.
Gateway Configuration
Click the gear icon on any gateway panel to open the configuration dialog where you can adjust connection settings, timeouts, and other gateway-specific parameters.
Interpreting Capacity Data
Healthy Patterns
- Utilization remains below 70% during peak hours
- Available capacity fluctuates as operations complete
- Holder count correlates with active extraction jobs
Warning Signs
- Utilization consistently above 80%
- Available capacity frequently reaches zero
- Target capacity differs from actual capacity (scaling in progress)
- Rapidly increasing holder count without capacity release
If capacity exhaustion occurs, new extraction requests will be queued or rejected depending on your configuration.
Capacity Planning Guidance
Use the Capacity dashboard to inform infrastructure decisions:
Short-Term Actions
- High utilization (>80%): Review queued jobs, consider manual intervention
- Zero availability: Check for stuck operations consuming capacity
- Mismatched target/capacity: Wait for scaling operation to complete
Long-Term Planning
- Sustained >70% utilization: Add gateway capacity or optimize workloads
- Multiple slot types at capacity: Consider dedicated gateways per operation type
- Uneven gateway utilization: Review load balancing configuration
Scaling Decisions
Monitor these patterns over time to determine when to scale:
- Peak utilization trends: If peaks are increasing, scale proactively
- Time-to-zero availability: Decreasing time indicates growing demand
- Holder queue depth: Increasing holders suggest capacity constraints
Real-Time Updates
The dashboard maintains a live tRPC SSE subscription to receive engine events:
- Events tagged with
RESOURCE_EXECUTOR_UPDATEDtrigger capacity refreshes - Auto-scroll keeps the latest updates visible (toggle on/off as needed)
- Connection status indicator shows subscription health
If real-time updates stop, check the connection status indicator and verify gateway connectivity in the Debug view.
Best Practices
- Monitor proactively: Set up alerts for capacity thresholds before issues occur
- Baseline normal utilization: Understand your typical patterns to identify anomalies
- Review during deployments: Watch capacity during gateway updates or configuration changes
- Correlate with jobs: Cross-reference capacity with the Jobs view to identify heavy operations
- Plan for peaks: Size capacity for peak load, not average utilization
Troubleshooting
Capacity not updating
- Verify gateway connection status in the Debug view
- Check that tRPC subscription is active (connection indicator)
- Manually refresh to force an update
Incorrect capacity values
- Confirm gateway configuration matches expected capacity
- Check that target capacity changes have completed
- Review gateway logs for capacity registration errors
High utilization with low job count
- Look for long-running operations holding capacity
- Check for stuck operations that haven’t released slots
- Review holder count vs. active job count for discrepancies
Use the Debug view alongside Capacity monitoring to correlate resource metrics with capacity utilization.