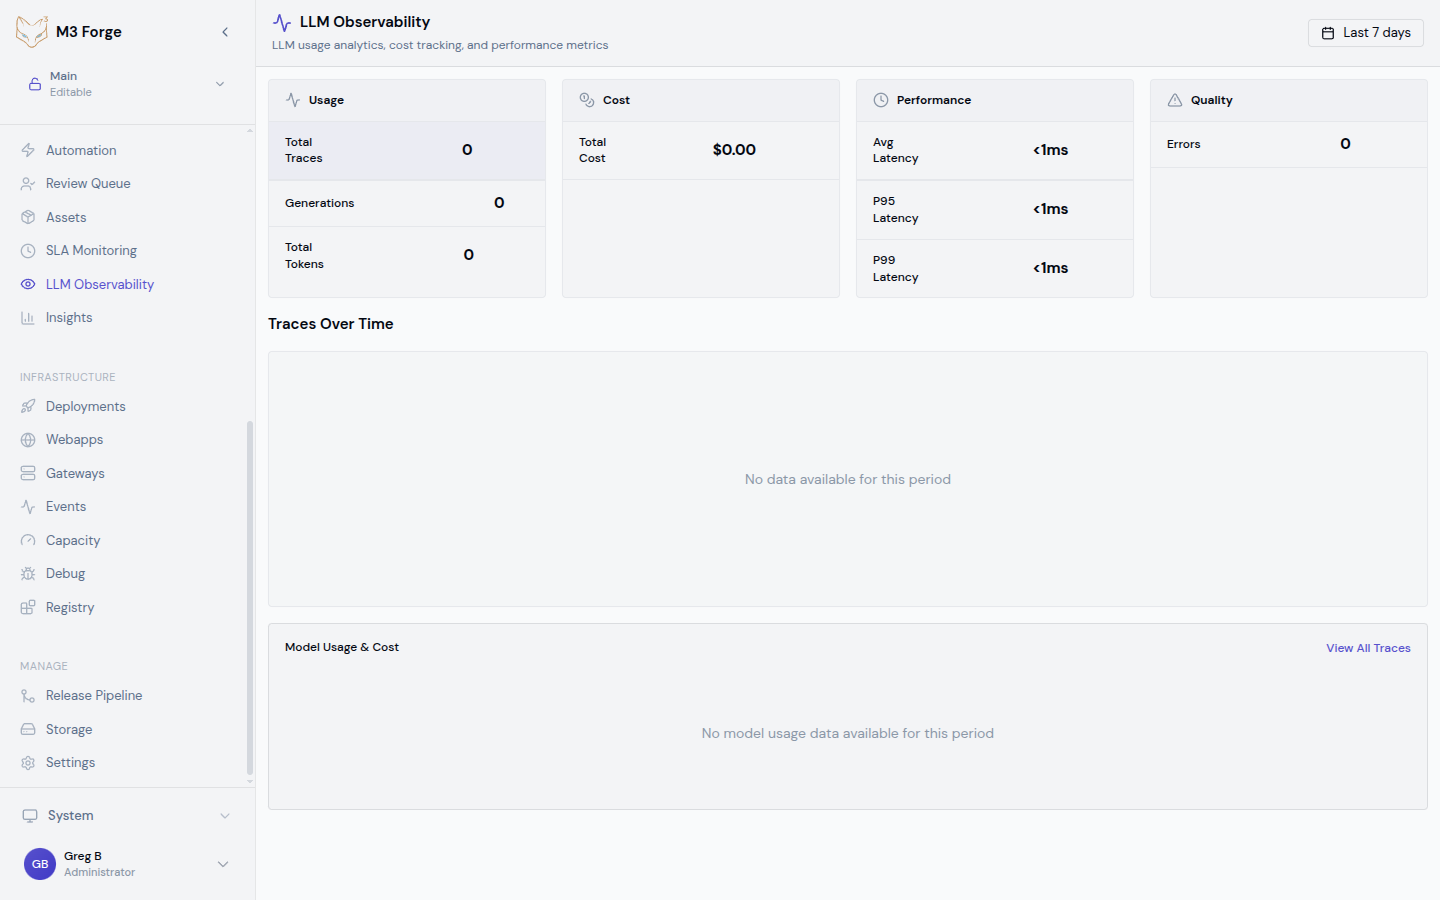
LLM Observability
Track LLM usage, costs, and performance across all AI operations with ClickHouse-powered analytics.
Overview
The LLM Observability dashboard provides real-time visibility into every AI model invocation in M3 Forge. It aggregates data from all workflows, agents, and manual prompt executions to help you:
- Monitor costs by model, workflow, and time period
- Analyze token usage to optimize prompt efficiency
- Track latency to identify performance bottlenecks
- Debug failures by drilling into specific traces
All data is stored in ClickHouse for fast aggregation queries over millions of LLM calls.
For executor-originated calls that run through Marie’s Valkey-backed dispatch path, use LLM Dispatch Runtime to inspect live pending/in-flight requests and dispatch health. LLM Observability remains the trace and analytics layer for completed calls.
Accessing the Dashboard
Navigate to Monitoring → LLM Observability in the sidebar or visit /llm-observability directly.
The dashboard displays:
- Cost summary cards showing total spend, average per call, and trend vs. previous period
- Token usage charts with breakdown by input vs. output tokens
- Latency percentiles (p50, p95, p99) over time
- Model distribution pie chart showing usage by provider and model
- Trace table with filterable list of recent LLM calls
Cost Tracking
How Costs are Calculated
M3 Forge maintains an internal pricing table for all major LLM providers:
| Provider | Models | Pricing Unit | Rate Source |
|---|---|---|---|
| OpenAI | GPT-4, GPT-3.5, o1 | Per 1M tokens | OpenAI Pricing |
| Anthropic | Claude 3.5, Claude 3 | Per 1M tokens | Anthropic Pricing |
| Gemini Pro, Gemini Flash | Per 1M tokens | Google AI Pricing | |
| Local | Custom models | $0.00 | Self-hosted |
Costs are computed as:
cost = (input_tokens / 1_000_000) * input_price +
       (output_tokens / 1_000_000) * output_price
Pricing is updated monthly from provider rate cards. Custom models can be configured with override pricing in Settings.
Filtering by Cost
Use the cost filter to find expensive operations:
- Top spenders - Sort by total cost descending to find workflows burning budget
- Cost per call - Identify inefficient prompts with high token counts
- Date range - Compare costs week-over-week or month-over-month
- By model - See which model tier (GPT-4 vs. GPT-3.5) drives costs
Cost Alerts
Configure budget alerts in Settings → Monitoring:
{
  "cost_alerts": [
    {
      "threshold": 100.00,
      "period": "daily",
      "notification": "slack"
    },
    {
      "threshold": 1000.00,
      "period": "monthly",
      "notification": "email"
    }
  ]
}
When spending exceeds a threshold, M3 Forge sends notifications via configured channels.
Token Usage Analytics
Input vs. Output Tokens
The token usage chart breaks down:
- Input tokens - System prompt, user prompt, and conversation history
- Output tokens - LLM-generated response
- Total tokens - Billed amount (input + output)
Use this to identify optimization opportunities:
- High input, low output - Prompt may include unnecessary context
- High output - Consider max_tokens limits or stopping criteria
- Ratio trends - Detect changes in prompt structure over time
Token Distribution
View token usage by:
- Workflow - Which pipelines consume the most tokens
- Node type - Compare Prompt nodes vs. Guardrail evaluation nodes
- Model - Track migration impact when switching GPT-4 → Claude
- User - Identify power users for capacity planning
Caching Impact
For providers that support prompt caching (Anthropic, OpenAI), the dashboard shows:
- Cache hit rate - Percentage of calls served from cache
- Cache savings - Estimated cost reduction from cache hits
- Cache TTL distribution - How long cached prompts remain valid
Latency Analysis
Metrics Tracked
For every LLM call, M3 Forge records:
- Time to first token (TTFT) - Latency until streaming begins
- Total generation time - End-to-end duration
- Queue time - How long request waited for gateway availability
- Network latency - Round-trip time to provider API
Latency Percentiles
The dashboard displays p50, p95, and p99 latencies:
- p50 - Typical performance under normal load
- p95 - Performance for slower requests (outliers)
- p99 - Worst-case latency for debugging timeout issues
High p99 latencies (>30s) may indicate gateway capacity issues or provider-side rate limiting.
Debugging Slow Calls
To investigate high latency:
Filter for slow traces
Set latency filter to > 10000ms to find outliers.
Group by model
Check if latency is model-specific (GPT-4 is slower than GPT-3.5 Turbo).
Inspect trace details
Click on a slow trace to see detailed timeline with network, queue, and generation time breakdown.
Check gateway health
Navigate to Admin → Gateways to verify connectivity and throughput.
Time-Series Charts
The LLM Observability dashboard includes interactive time-series visualizations:
Cost Over Time
- Daily cost trend with moving average
- Stacked area chart showing cost breakdown by model
- Comparison mode to diff two time periods
Token Usage Over Time
- Input and output tokens as separate series
- Cumulative token count for billing verification
- Per-workflow breakdown with color-coded lines
Latency Over Time
- p50/p95/p99 bands showing latency distribution
- Anomaly detection highlighting unusual spikes
- Correlation with cost to see if expensive calls are also slow
Filtering and Querying
The trace table supports rich filtering:
| Filter | Type | Example |
|---|---|---|
| Date range | Absolute or relative | Last 7 days, 2024-03-01 to 2024-03-19 |
| Model | Multi-select | gpt-4-turbo, claude-3-5-sonnet |
| Workflow | Autocomplete | Customer onboarding pipeline |
| Status | Enum | success, error, timeout |
| Cost | Numeric range | $0.10 - $1.00 |
| Latency | Numeric range | 5000ms - 30000ms |
| User | Autocomplete | user@example.com |
Filters can be combined with AND logic and saved as presets for quick access.
Exporting Data
Export LLM observability data for external analysis:
CSV
# Download filtered traces as CSV
curl -H "Authorization: Bearer $TOKEN" \
"http://localhost:3500/api/llm-observability/export?format=csv&start=2024-03-01&end=2024-03-19"ClickHouse Schema
LLM traces are stored in the llm_traces table:
CREATE TABLE llm_traces (
  trace_id String,
  timestamp DateTime,
  model String,
  workflow_id Nullable(String),
  node_id Nullable(String),
  user_id Nullable(String),
  input_tokens UInt32,
  output_tokens UInt32,
  cost Float64,
  latency_ms UInt32,
  ttft_ms Nullable(UInt32),
  status Enum('success', 'error', 'timeout'),
  error_message Nullable(String),
  request_payload String,
  response_payload String,
  metadata String
) ENGINE = MergeTree()
PARTITION BY toYYYYMM(timestamp)
ORDER BY (timestamp, model, workflow_id);
Materialized views provide fast aggregations for the dashboard queries.
Best Practices
Cost Optimization
- Use smaller models where possible (GPT-3.5 instead of GPT-4 for simple tasks)
- Enable prompt caching for repeated system prompts
- Limit max_tokens to prevent runaway generation costs
- Monitor daily to catch budget overruns early
Performance Tuning
- Batch requests when possible to reduce per-call overhead
- Use streaming for user-facing generations to improve perceived latency
- Set aggressive timeouts to fail fast on slow calls
- Monitor TTFT to detect gateway capacity issues
Debugging
- Start with filters to narrow down problematic traces
- Compare similar calls to understand variability
- Check request payloads for unexpected prompt changes
- Correlate with workflow runs to see full execution context
Next Steps
- Inspect individual traces for detailed debugging
- Inspect LLM Dispatch Runtime for live executor LLM dispatch state
- Set up SLA monitoring for critical workflows
- Analyze workflow insights for performance trends