Debug
Real-time gateway health and performance diagnostics for troubleshooting infrastructure issues and monitoring system resources.
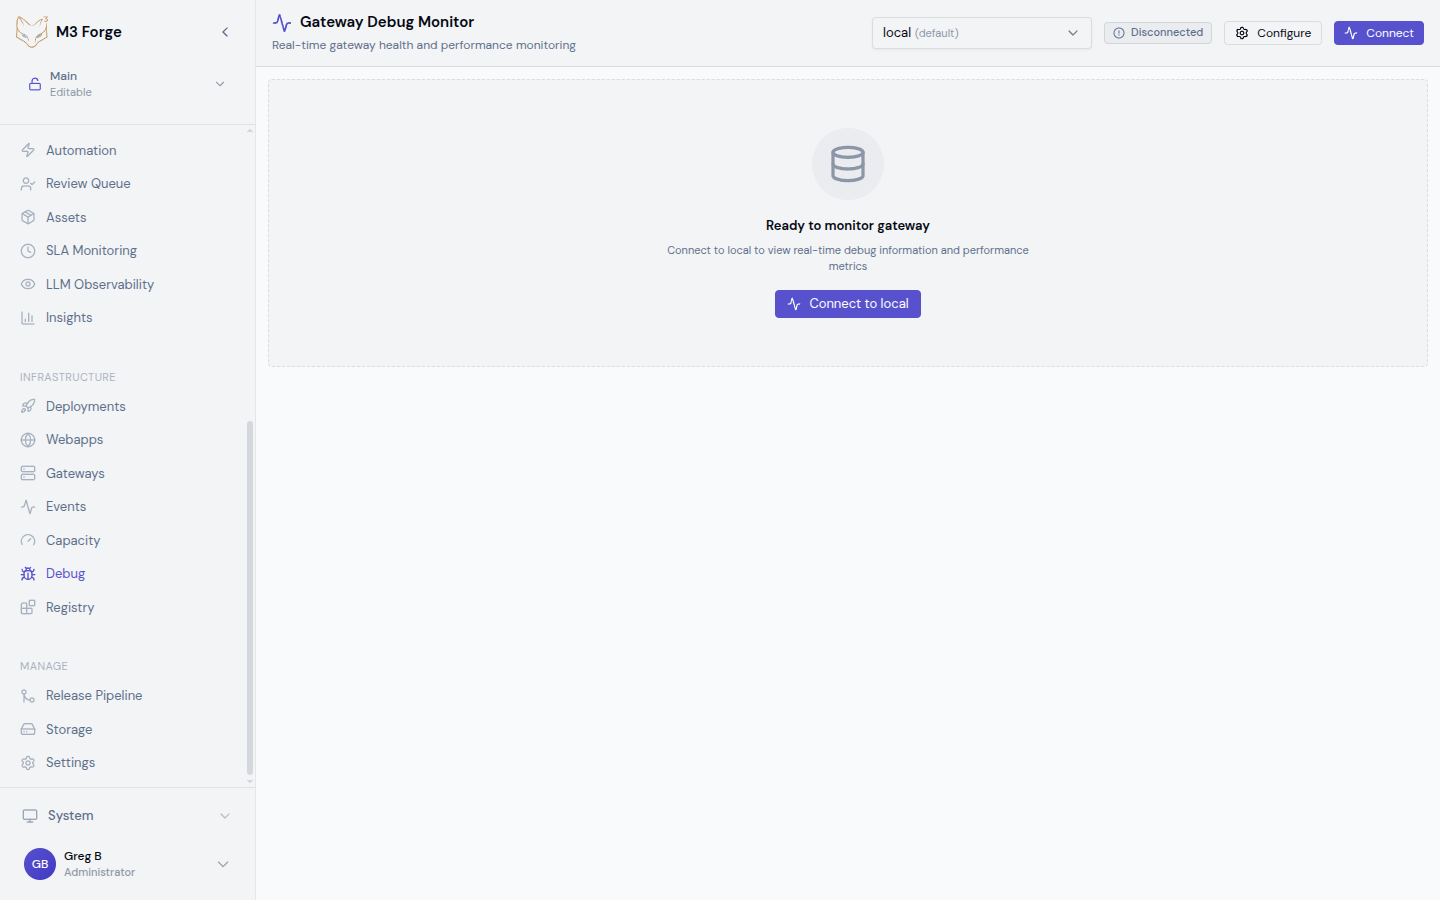
Overview
The Debug view provides deep visibility into individual gateway health, focusing on one gateway at a time to deliver detailed diagnostic information. Use this view to troubleshoot connectivity issues, investigate performance problems, and monitor resource consumption.
Key capabilities:
- Gateway-specific health monitoring
- Real-time resource metrics (CPU, memory)
- Process information and uptime tracking
- Configurable auto-refresh intervals
- Detailed error messages with troubleshooting hints
Debug information is retrieved via the gateways.getDebugInfo tRPC endpoint.
Gateway Selection
The Debug view focuses on a single gateway at a time to provide comprehensive diagnostics:
- Use the gateway selector dropdown to choose which gateway to debug
- The view updates immediately to show detailed information for the selected gateway
- Switch between gateways to compare health status or investigate specific issues
If you need to monitor multiple gateways simultaneously, use the Capacity view for aggregate metrics.
Status Cards
At the top of the Debug view, status cards provide quick health indicators:
| Card | Information |
|---|---|
| Connection Status | Connected, disconnected, or error state |
| Last Health Check | Timestamp of most recent successful health probe |
| System Uptime | How long the gateway process has been running |
| Resource Utilization | Summary of CPU and memory usage |
These cards highlight critical issues that require immediate attention.
Connection Status Indicators
- Connected (Green): Gateway is reachable and responding to health checks
- Degraded (Yellow): Gateway is responding but reporting errors or warnings
- Disconnected (Red): Gateway is unreachable or failed health checks
- Unknown (Gray): Health status has not been determined yet
Debug Information Display
The main debug panel shows comprehensive gateway diagnostics:
Gateway Health Status
- Health State: Overall health (healthy/degraded/critical)
- Status Message: Human-readable status description
- Error Count: Number of errors since last restart
- Warning Count: Number of warnings since last restart
A degraded or critical health state indicates the gateway may not be processing requests reliably.
Process Information
- Process ID: Operating system process identifier
- Start Time: When the gateway process was started
- Uptime: Calculated duration since process start
- Version: Gateway software version
- Configuration Hash: Checksum of active configuration
Use process information to verify correct versions are deployed and identify long-running processes that may need restart.
Resource Metrics
Real-time resource consumption data:
| Metric | Description | Alert Threshold |
|---|---|---|
| CPU Usage | Percentage of CPU cores in use | >80% sustained |
| Memory Usage | RAM consumed by gateway process | >90% of limit |
| Memory Limit | Configured memory ceiling | N/A |
| Thread Count | Active threads in the process | Depends on config |
| File Descriptors | Open file handles | OS-dependent |
High CPU or memory usage may indicate performance issues, memory leaks, or insufficient resources.
Performance Metrics
- Request Rate: Requests per second over last minute
- Average Response Time: Mean response time (milliseconds)
- Error Rate: Percentage of failed requests
- Queue Depth: Number of queued requests waiting for processing
Performance metrics help identify bottlenecks and capacity issues.
Configuration Details
- Configured Capacity: Total capacity slots by type
- Active Connectors: Registered extraction connectors
- Feature Flags: Enabled/disabled features
- Environment: Production, staging, or development
Configuration details confirm the gateway is running with expected settings.
Control Panel
The debug control panel provides manual and automatic refresh options:
Manual Refresh
Click the “Refresh” button to immediately fetch the latest debug information. Useful when:
- Investigating an issue and want to see immediate changes
- Auto-refresh is disabled
- Verifying a configuration change took effect
Auto-Refresh Toggle
Enable auto-refresh to continuously poll for updated debug information without manual intervention. The toggle button shows the current state (on/off).
Refresh Intervals
Configure how frequently debug information is refreshed:
- 1 second: High-frequency monitoring during active troubleshooting
- 2 seconds: Balanced refresh rate for most debugging scenarios
- 5 seconds: Moderate refresh for longer-term observation
- 10 seconds: Low-frequency refresh to minimize load
Shorter refresh intervals provide more real-time data but increase load on the gateway. Use 1-2 second intervals only during active debugging.
Understanding Debug Information
When to Use Debug View
Use the Debug view in these scenarios:
Troubleshooting Connection Issues
If a gateway appears disconnected or unreachable, check:
- Connection status card (is the gateway responding?)
- Error messages (network issues, authentication failures)
- Last health check timestamp (when did it last respond?)
Investigating Performance Problems
For slow extraction operations, review:
- CPU and memory usage (resource exhaustion?)
- Request rate and response time (overloaded?)
- Queue depth (backlog of pending requests?)
Verifying Configuration Changes
After updating gateway settings, confirm:
- Configuration hash changed
- Feature flags reflect new values
- Capacity settings match expected values
Monitoring Resource Consumption
During load testing or production operations:
- Track CPU/memory trends over time
- Identify resource leaks (increasing memory without release)
- Verify resource limits are appropriate
Detailed Error Messages
When errors occur, the Debug view displays comprehensive error information:
- Error Type: Classification of the error (network, authentication, configuration)
- Error Message: Detailed description of what went wrong
- Troubleshooting Hints: Suggested actions to resolve the issue
- Stack Trace (when available): Technical details for advanced debugging
Common Error Scenarios
| Error Type | Possible Causes | Troubleshooting Steps |
|---|---|---|
| Connection Refused | Gateway not running, wrong port, firewall | Verify gateway process, check network connectivity |
| Authentication Failed | Invalid credentials, expired token | Update authentication configuration |
| Timeout | Gateway overloaded, network latency | Check resource metrics, increase timeout |
| Configuration Error | Invalid settings, missing required fields | Review gateway configuration, check logs |
| Resource Exhausted | Out of memory, disk full | Check resource metrics, scale resources |
Copy error messages and stack traces when reporting issues to support or investigating in gateway logs.
Uptime Calculations
The Debug view calculates system uptime from the process start time:
- Uptime Display: Human-readable format (e.g., “2 days, 14 hours, 23 minutes”)
- Start Time: Absolute timestamp when the process started
- Current Time: Server time used for calculation
Use uptime to:
- Verify recent deployments or restarts
- Identify gateways that have been running for extended periods
- Correlate issues with process lifecycle events
Long uptimes are generally positive, but very old processes may benefit from periodic restarts to clear accumulated state.
Common Diagnostic Scenarios
Scenario 1: Gateway Not Processing Requests
Symptoms: Queue depth increasing, requests timing out
Debug checklist:
- Check connection status (is it connected?)
- Review resource metrics (CPU/memory exhausted?)
- Check error count (failures preventing processing?)
- Verify configuration (capacity set to zero?)
Scenario 2: Slow Performance
Symptoms: High response times, low throughput
Debug checklist:
- Check CPU usage (near 100%?)
- Review memory usage (swapping?)
- Check thread count (thread pool exhausted?)
- Review queue depth (backlog building up?)
Scenario 3: Memory Leak Suspected
Symptoms: Memory usage continuously increasing
Debug checklist:
- Enable auto-refresh at 5-second intervals
- Monitor memory usage over 10-15 minutes
- Compare memory to request rate (growing without load?)
- Check uptime (fresh restart or long-running?)
Scenario 4: Configuration Issues
Symptoms: Gateway behaving unexpectedly, features not working
Debug checklist:
- Verify configuration hash changed after update
- Review feature flags (expected features enabled?)
- Check capacity settings (match intended values?)
- Review error messages for configuration-specific errors
Best Practices
- Use focused debugging: Debug one gateway at a time for detailed analysis
- Adjust refresh rate: Use faster intervals during active troubleshooting, slower for observation
- Baseline normal metrics: Understand typical CPU/memory/response time to identify anomalies
- Document error patterns: Keep track of recurring errors for pattern analysis
- Correlate with logs: Cross-reference debug info with gateway application logs
Troubleshooting the Debug View
Debug information not loading
- Verify gateway is running and reachable
- Check network connectivity between M3 Forge and gateway
- Review tRPC connection status
- Try manual refresh to force an update
Stale data displayed
- Verify auto-refresh is enabled
- Check refresh interval setting
- Confirm gateway is responding to health checks
- Try disconnecting and reconnecting to the gateway
Incorrect metrics
- Compare with gateway’s own metrics/logs
- Verify clock synchronization between M3 Forge and gateway
- Check for configuration mismatches
- Restart gateway if metrics appear corrupted
If debug information is consistently incorrect or unavailable, verify the tRPC endpoint configuration and gateway API compatibility.