Insights
Analyze workflow performance with metrics, trends, and failure rate tracking.
Overview
The Insights dashboard provides high-level analytics for workflow execution performance. It aggregates data across all workflow runs to help you:
- Track success rates to ensure reliability
- Measure time saved through automation
- Identify problematic workflows with high failure rates
- Analyze trends to detect degradation or improvement
- Plan capacity based on execution volume
Unlike LLM Observability (which focuses on AI costs) and Traces (which focus on individual calls), Insights focuses on workflow-level operational metrics.
Accessing the Dashboard
Navigate to Monitoring → Insights in the sidebar or visit /insights directly.
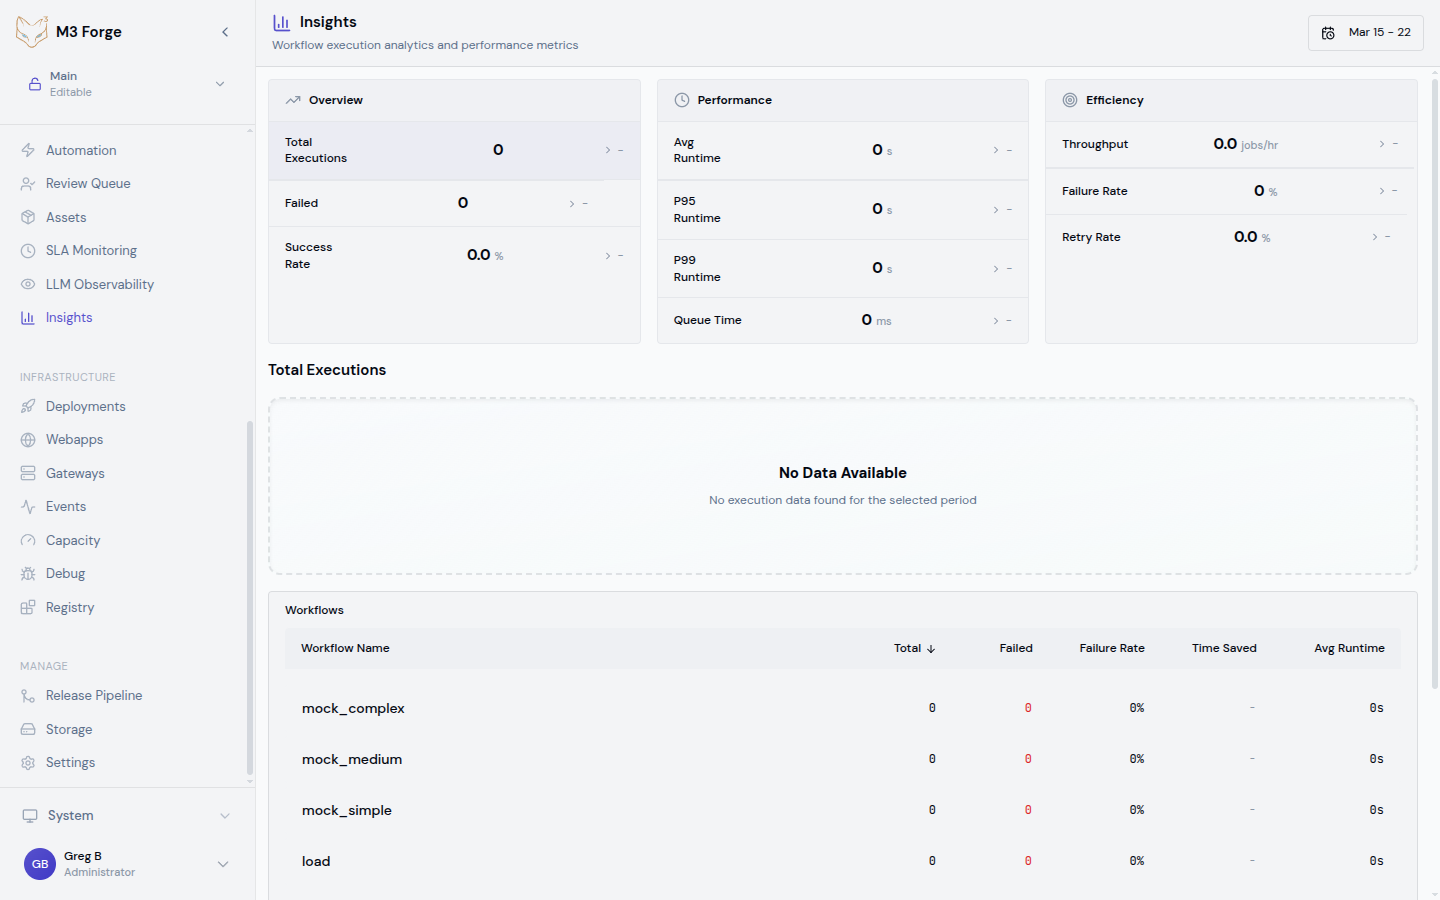
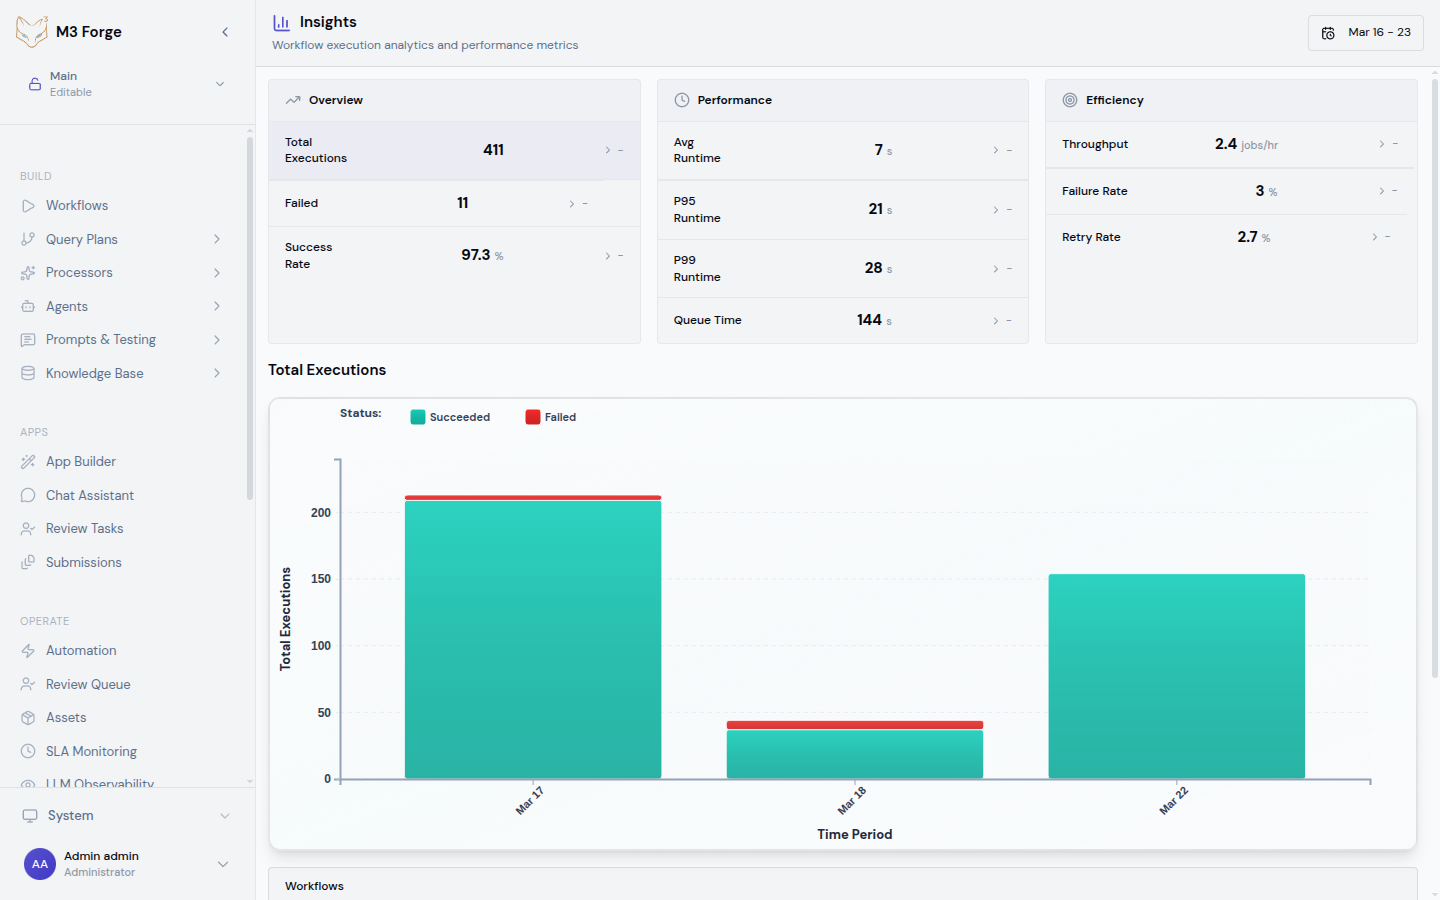
The dashboard displays:
- Summary metrics - Total runs, failed count, failure rate, time saved, average runtime
- Date range selector - Last 7 days, 30 days, custom range
- Workflow breakdown table - Metrics per workflow with sorting and filtering
- Trend charts - Time-series visualization of runs, failures, and latency
Key Metrics
Total Runs
The total number of workflow executions in the selected date range.
Includes:
- Manual trigger executions
- Scheduled (cron) executions
- Event-triggered executions
- API-initiated executions
Excludes:
- Test runs in the canvas editor
- Dry-run validations
- Aborted executions before first node
Use this metric to:
- Understand workload - Track execution volume over time
- Validate triggers - Ensure scheduled workflows are running as expected
- Measure adoption - See which workflows are actively used
Failed Count
The number of workflow runs that ended in failed status.
A run is considered failed if:
- Any node throws an unhandled exception
- A Guardrail node routes to a terminal failure path
- Execution times out (exceeds configured max duration)
- External dependency is unavailable (database, API, gateway)
Runs that are manually stopped or cancelled are not counted as failures.
Use this metric to:
- Identify unstable workflows - High failure counts indicate reliability issues
- Prioritize debugging - Focus on workflows with most frequent failures
- Track improvement - Measure impact of bug fixes and error handling
Failure Rate
The percentage of runs that failed: (failed_count / total_runs) * 100.
Thresholds:
| Rate | Status | Action |
|---|---|---|
| < 1% | Healthy | No action needed |
| 1-5% | Warning | Monitor for trends |
| 5-10% | Degraded | Investigate root causes |
| > 10% | Critical | Immediate debugging required |
Use this metric to:
- Compare workflows - Which pipelines are most reliable?
- Set SLA targets - Define acceptable failure rates for critical workflows
- Detect regressions - Catch new bugs introduced by changes
Time Saved
The total time saved through automation, calculated as:
time_saved = total_runs * estimated_manual_time_per_runWhere estimated_manual_time_per_run is configured per workflow in Settings (default: 5 minutes).
Example:
- 1,000 runs of invoice processing workflow
- Manual processing time: 10 minutes per invoice
- Time saved: 10,000 minutes (166.7 hours)
Use this metric to:
- Justify automation - Quantify ROI for stakeholders
- Prioritize optimization - Focus on high-volume workflows
- Track efficiency - Measure cumulative time saved over months
Average Runtime
The mean duration of all successful workflow runs in the selected date range.
Calculated as:
average_runtime = SUM(duration of successful runs) / COUNT(successful runs)Interpretation:
- Increasing over time - Possible performance regression or data volume growth
- High variance - Workflow performance is inconsistent (investigate node-level latency)
- Correlation with failures - Slow runs may be timing out
Use this metric to:
- Benchmark performance - Establish baseline for expected runtime
- Detect bottlenecks - Compare with node-level timing from Traces
- Optimize workflows - Identify candidates for parallelization or caching
Workflow Breakdown Table
The breakdown table lists all workflows with per-workflow metrics:
| Workflow | Runs | Failed | Failure Rate | Avg Runtime | Time Saved |
|---|---|---|---|---|---|
| Invoice extraction | 2,341 | 23 | 0.98% | 4.2s | 195 hrs |
| Customer onboarding | 1,567 | 89 | 5.68% | 12.1s | 130 hrs |
| Document classification | 987 | 3 | 0.30% | 1.8s | 82 hrs |
Sorting
Click column headers to sort by:
- Runs - Find most frequently executed workflows
- Failed - Identify workflows with most failures
- Failure Rate - Prioritize unreliable workflows
- Avg Runtime - Find slow workflows
- Time Saved - See which workflows provide most value
Filtering
Filter the table by:
- Workflow name - Text search (autocomplete)
- Status - Show only healthy, degraded, or critical workflows
- Tags - Custom tags assigned to workflows (e.g., “production”, “experimental”)
Drill-Down
Click any workflow row to:
- View DAG - Open the workflow canvas editor
- See all runs - Navigate to filtered Runs view
- Inspect traces - Jump to LLM Observability for cost analysis
Trend Analysis
The trend charts visualize metrics over time to detect patterns and anomalies.
Runs Over Time
Line chart showing daily execution volume:
- Peaks - Identify days with unusually high activity
- Valleys - Detect missing scheduled executions
- Trend line - See if usage is growing or declining
Use this chart to:
- Validate scheduled trigger configuration
- Correlate spikes with external events (marketing campaigns, product launches)
- Plan infrastructure scaling based on growth trends
Failure Rate Over Time
Line chart with failure rate percentage:
- Spikes - Indicate new bugs or external dependency outages
- Gradual increase - May signal data quality degradation
- Step changes - Correlate with deployments or config changes
Hover over any point to see the exact date, failure rate, and raw counts.
Use this chart to:
- Detect regressions immediately after releases
- Correlate failures with external events (API downtime, gateway issues)
- Measure impact of bug fixes (failure rate should decrease)
Average Runtime Over Time
Line chart showing mean execution duration:
- Increasing - Possible performance regression
- Decreasing - Optimization improvements
- Spikes - Transient latency issues (gateway slow, database contention)
Use this chart to:
- Benchmark before/after optimization efforts
- Detect performance degradation early
- Correlate with LLM latency from Traces
Date Range Filtering
Select different time windows to analyze metrics:
Predefined Ranges
- Last 7 days - For daily operational monitoring
- Last 30 days - For monthly performance reviews
- Last 90 days - For quarterly trend analysis
Custom Range
Pick arbitrary start and end dates for:
- Comparing specific periods - Week before vs. after a release
- Isolating incidents - Narrow to the exact time window of an outage
- Quarterly reporting - Match fiscal calendar
Comparison Mode
Toggle “Compare with previous period” to overlay:
- Current vs. previous week
- Current vs. previous month
- Current vs. same period last year
This highlights:
- Growth - Is execution volume increasing?
- Regression - Did failure rate get worse?
- Seasonality - Are there predictable patterns?
Alerts and Thresholds
Configure automatic alerts based on Insights metrics:
Navigate to Settings
Go to Settings → Monitoring → Insights Alerts.
Create alert rule
Define condition (e.g., “Failure rate > 5% for 1 hour”).
Choose notification channel
Select Slack, email, PagerDuty, or webhook.
Set severity
Choose warning, error, or critical based on business impact.
Example Alert Rules
{
  "alerts": [
    {
      "name": "High failure rate - Invoice extraction",
      "condition": "failure_rate > 5%",
      "workflow": "invoice-extraction",
      "duration": "1h",
      "notification": "slack",
      "severity": "error"
    },
    {
      "name": "Slow execution - Customer onboarding",
      "condition": "avg_runtime > 30s",
      "workflow": "customer-onboarding",
      "duration": "30m",
      "notification": "email",
      "severity": "warning"
    }
  ]
}
Exporting Data
Export Insights metrics for external analysis or reporting:
CSV Export
Download workflow breakdown table:
curl -H "Authorization: Bearer $TOKEN" \
  "http://localhost:3500/api/insights/export?format=csv&start=2024-03-01&end=2024-03-19" \
  -o insights.csv
JSON Export
Programmatic access to metrics:
curl -H "Authorization: Bearer $TOKEN" \
  "http://localhost:3500/api/insights/export?format=json&start=2024-03-01&end=2024-03-19" \
  | jq '.workflows[] | {name, failure_rate, avg_runtime}'
Dashboard Snapshots
Save a point-in-time snapshot for quarterly reviews:
- Click “Export Snapshot” in the dashboard header
- Select date range and workflows to include
- Download as PDF or share link with stakeholders
Performance Optimization
Use Insights to identify optimization opportunities:
Finding Slow Workflows
Sort by Average Runtime
Click the “Avg Runtime” column header (descending).
Identify outliers
Look for workflows >10s when others are <5s.
Drill into Traces
Click the workflow row and select “View Traces” to see LLM latency breakdown.
Optimize bottlenecks
Reduce prompt size, enable caching, or parallelize independent nodes.
Reducing Failures
Sort by Failure Rate
Click the “Failure Rate” column header (descending).
Examine failure logs
Navigate to Runs view and filter by failed status.
Identify root causes
Common issues: invalid data, timeout, external API errors.
Add error handling
Implement retry logic, input validation, or graceful degradation.
Best Practices
Daily Monitoring
Check Insights dashboard daily to:
- Verify overnight scheduled workflows completed successfully
- Catch failure rate spikes early
- Identify unexpected execution volume changes
Weekly Reviews
Run weekly performance reviews:
- Compare metrics week-over-week
- Investigate any workflows with degraded performance
- Celebrate improvements (lower failure rates, faster runtimes)
Monthly Reporting
Generate monthly reports for stakeholders:
- Total time saved through automation
- Reliability improvements (failure rate trends)
- Top-performing workflows (high runs, low failures)
Correlation with Deployments
After any release or configuration change:
- Check Insights for failure rate changes
- Compare average runtime before and after
- Rollback if metrics degrade significantly
Next Steps
- Configure SLA Monitoring for threshold-based alerts
- Review LLM Observability for cost and token usage
- Inspect Traces for detailed failure debugging
- Optimize workflows based on average runtime analysis