SLA Monitoring
Monitor service level agreement compliance and threshold violations for critical workflows.
Overview
SLA (Service Level Agreement) monitoring ensures that your AI workflows meet defined performance and reliability commitments. It provides:
- Real-time compliance tracking against SLA targets
- Automated alerting when thresholds are breached
- Historical compliance reports for auditing and accountability
- Multi-dimensional SLAs (latency, availability, error rate, throughput)
SLA monitoring bridges operational metrics (Insights) with business commitments, enabling you to proactively manage service quality.
What is an SLA?
An SLA defines measurable performance targets for a workflow or service:
| SLA Type | Metric | Example Target |
|---|---|---|
| Availability | Uptime percentage | 99.9% (43 min downtime/month) |
| Latency | Response time percentile | p95 latency < 5 seconds |
| Error Rate | Failed executions | Failure rate < 2% |
| Throughput | Requests per second | Handle 100 runs/minute peak load |
M3 Forge monitors these targets in real-time and alerts when violations occur.
SLA Configuration
Navigate to Monitoring → SLA Monitoring and click “Create SLA” to define a new agreement.
Basic Configuration
{
  "name": "Invoice Extraction SLA",
  "workflow_id": "invoice-extraction-v2",
  "enabled": true,
  "description": "Production SLA for invoice processing pipeline"
}
Targets
Define one or more performance targets:
Latency
{
  "type": "latency",
  "metric": "p95_runtime",
  "threshold": 5000,
  "unit": "ms",
  "evaluation_window": "5m"
}
Explanation:
- 95th percentile runtime must be under 5 seconds
- Evaluated over a rolling 5-minute window
- Violation if p95 exceeds threshold for entire window
Alerting
Configure how and when to notify on SLA violations:
{
  "alert": {
    "channels": ["slack", "email", "pagerduty"],
    "severity": "high",
    "notification_delay": "5m",
    "escalation_policy": "on-call-rotation"
  }
}
Options:
- channels - Where to send alerts (Slack, email, PagerDuty, webhooks)
- severity -
low,medium,high,critical(affects urgency) - notification_delay - Grace period before alerting (reduces noise from transient issues)
- escalation_policy - Who to notify if violation persists (defined in Settings → On-Call)
Time-Based Rules
Define SLA windows that vary by time of day or day of week:
{
  "schedules": [
    {
      "name": "Business hours",
      "cron": "0 8-18 * * 1-5",
      "timezone": "America/New_York",
      "targets": [
        {"type": "latency", "threshold": 3000}
      ]
    },
    {
      "name": "Off-hours",
      "cron": "0 0-7,19-23 * * *",
      "timezone": "America/New_York",
      "targets": [
        {"type": "latency", "threshold": 10000}
      ]
    }
  ]
}
Use case: Stricter latency requirements during business hours when users are actively waiting for results.
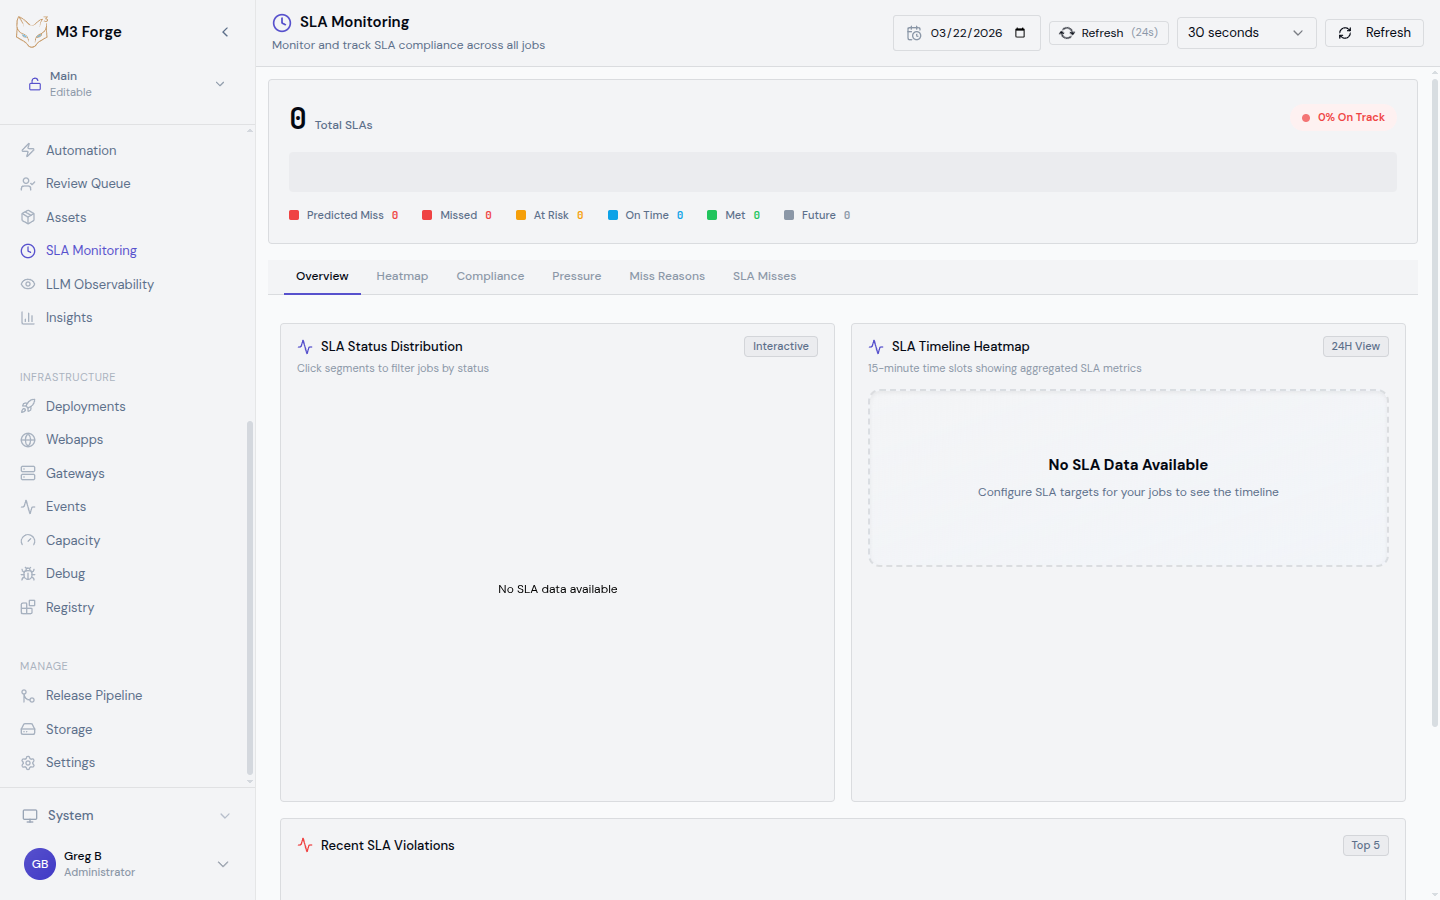
SLA Dashboard
The SLA Monitoring dashboard displays real-time compliance status:
Summary Cards
- Active SLAs - Count of enabled SLAs
- Violations (Last 24h) - Number of threshold breaches
- Compliance Score - Percentage of time SLAs were met
- MTTD (Mean Time to Detect) - Average delay before violation detection
SLA Table
| SLA | Workflow | Status | Current Value | Target | Last Violation |
|---|---|---|---|---|---|
| Invoice latency | invoice-extraction-v2 | Healthy | 3.2s | < 5s | 2 days ago |
| Customer onboarding error rate | customer-onboarding | Warning | 1.8% | < 2% | 3 hours ago |
| Document classification availability | doc-classify | Violated | 98.5% | 99.9% | 12 min ago |
Status indicators:
- Healthy (green) - Currently meeting SLA targets
- Warning (yellow) - Approaching threshold (within 10%)
- Violated (red) - Currently breaching SLA
Click any row to see detailed compliance history and violation timeline.
Compliance Chart
Time-series visualization showing:
- Target threshold - Horizontal line showing SLA limit
- Actual metric - Line chart of measured performance
- Violation periods - Red shaded regions where SLA was breached
- Warning zone - Yellow shaded region near threshold
Zoom into specific time ranges to analyze violation patterns.
Violation Detection
M3 Forge uses a time-window-based detection algorithm:
Collect metric samples
Every 30 seconds, the monitoring system queries the database for workflow execution metrics.
Calculate aggregate
Compute the metric value over the evaluation window (e.g., p95 latency for last 5 minutes).
Compare to threshold
If aggregate value exceeds (or falls below for throughput) the SLA target, mark as potential violation.
Apply grace period
If the violation persists for the configured notification_delay, trigger an alert.
Send notifications
Dispatch alerts to all configured channels (Slack, email, PagerDuty).
Track violation
Record violation event in database with start time, end time, duration, and max deviation from target.
Violation Events
Each SLA violation is logged as an event with full context:
{
  "violation_id": "v_abc123",
  "sla_id": "sla_invoice_latency",
  "workflow_id": "invoice-extraction-v2",
  "started_at": "2024-03-19T14:23:15Z",
  "ended_at": "2024-03-19T14:31:42Z",
  "duration_seconds": 507,
  "metric": "p95_runtime",
  "target": 5000,
  "measured_value": 8234,
  "max_deviation": 3234,
  "severity": "high",
  "root_cause": "Gateway timeout spike",
  "resolution": "Increased gateway concurrency limit"
}
Violation Details
View full details for any violation:
- Timeline - Minute-by-minute metric values during violation
- Impacted runs - List of workflow executions affected
- Correlated events - Other system events at the same time (deployments, alerts)
- Root cause analysis - AI-suggested probable causes based on patterns
Acknowledging Violations
Mark violations as acknowledged to track incident response:
- Acknowledge - Team is aware and investigating
- Assign - Assign to specific team member
- Resolve - Mark as fixed with resolution notes
This creates an audit trail for post-incident review.
Compliance Reports
Generate compliance reports for stakeholder communication:
Monthly SLA Report
Automatically generated report showing:
- SLA compliance percentage for each workflow
- Number of violations and total downtime
- MTTR (Mean Time to Recovery) - How quickly violations were resolved
- Trend analysis - Compliance improving or degrading?
Custom Reports
Create ad-hoc reports for specific date ranges:
Select date range
Choose start and end dates for the report period.
Select SLAs
Include all SLAs or filter to specific workflows.
Choose format
Download as PDF, CSV, or JSON.
Add annotations
Include notes about known incidents, planned maintenance, or process changes.
Exporting Data
# Export SLA compliance data as JSON
curl -H "Authorization: Bearer $TOKEN" \
  "http://localhost:3500/api/sla/report?start=2024-03-01&end=2024-03-31&format=json" \
  -o sla-report.json

# Export violation events as CSV
curl -H "Authorization: Bearer $TOKEN" \
  "http://localhost:3500/api/sla/violations?start=2024-03-01&end=2024-03-31&format=csv" \
  -o violations.csv
Alerting Integrations
M3 Forge integrates with popular incident management platforms:
Slack
Post SLA violation alerts to Slack channels:
{
  "channel": "#production-alerts",
  "webhook_url": "https://hooks.slack.com/services/...",
  "message_template": "⚠️ SLA Violation: {{sla.name}}\nWorkflow: {{workflow.name}}\nMetric: {{metric}} = {{value}} (target: {{target}})\nDuration: {{duration}}"
}
PagerDuty
Trigger incidents with automatic escalation:
{
  "integration_key": "R_KPMLK...",
  "service_id": "PSERVICE123",
  "severity": "high",
  "escalation_policy": "engineering-on-call"
}Send detailed violation emails to team distribution lists:
{
  "recipients": ["team@example.com", "oncall@example.com"],
  "subject_template": "[SLA VIOLATION] {{sla.name}} - {{workflow.name}}",
  "include_attachments": true
}
Webhooks
POST violation events to custom endpoints:
POST https://your-api.com/sla-webhook
Content-Type: application/json

{
  "event_type": "sla.violation.started",
  "sla_id": "sla_invoice_latency",
  "workflow_id": "invoice-extraction-v2",
  "metric": "p95_runtime",
  "target": 5000,
  "measured_value": 8234,
  "timestamp": "2024-03-19T14:23:15Z"
}
Best Practices
Setting Realistic Targets
Avoid setting SLA targets that are too strict. Use historical performance data to establish achievable thresholds.
Recommended approach:
- Baseline measurement - Run workflow for 1 week without SLAs to collect data
- Analyze percentiles - Use p95 or p99 latency as baseline, not average
- Add buffer - Set SLA threshold 20-30% looser than observed baseline
- Iterate - Tighten thresholds gradually as performance improves
Evaluation Windows
Choose evaluation windows that balance responsiveness and noise reduction:
| Window | Use Case |
|---|---|
| 1-5 minutes | Critical user-facing workflows requiring fast detection |
| 15-30 minutes | Background batch processing workflows |
| 1 hour | Availability SLAs with expected transient failures |
Shorter windows detect issues faster but may trigger false alarms from momentary spikes.
Notification Delay
Add a grace period to reduce alert fatigue:
- No delay - For critical SLAs where every second of violation matters
- 5 minutes - Filters transient spikes from brief gateway slowdowns
- 15 minutes - For less critical workflows or known-flaky dependencies
Multi-Tier SLAs
Define different SLAs for different workflow priority tiers:
{
  "critical_workflows": {
    "latency_target": 3000,
    "error_rate_target": 1.0,
    "availability_target": 99.95
  },
  "standard_workflows": {
    "latency_target": 10000,
    "error_rate_target": 5.0,
    "availability_target": 99.5
  }
}
Tag workflows with priority level and assign appropriate SLA tier.
Troubleshooting Violations
When an SLA violation occurs:
Check the violation timeline
View the compliance chart to see when the violation started and how severe it was.
Correlate with other metrics
Cross-reference with:
- LLM Observability for cost or latency spikes
- Insights for failure rate changes
- Traces for specific failed calls
Inspect impacted runs
Navigate to the Runs view filtered to the violation time window.
Identify root cause
Common causes:
- Gateway timeout - Marie-AI gateway overloaded or network issue
- External dependency - Database slow query, S3 unavailability
- Data quality - Input data triggered edge case or validation failure
- Resource contention - Too many concurrent executions
Implement fix
Address root cause with code changes, configuration tuning, or infrastructure scaling.
Verify resolution
Monitor SLA dashboard to ensure metric returns below threshold.
Next Steps
- Set up LLM Observability to track cost drivers
- Configure Insights alerts for failure rate thresholds
- Review Traces when investigating SLA violations
- Define escalation policies for on-call rotation