Prompt Experiments (A/B Tests)
Run controlled A/B tests to systematically optimize prompts with statistical rigor. Define variants, split traffic, collect metrics, and let M3 Forge calculate which version performs best.
Overview
Prompt engineering is iterative. Small changes can dramatically improve or degrade quality. Experiments remove guesswork by testing multiple variants under identical conditions and measuring performance with statistical significance.
M3 Forge manages the entire experiment lifecycle: setup, execution, metric collection, analysis, and deployment of winning variants.
Why Run Experiments?
Data-Driven Optimization
Intuition about prompt quality is often wrong. A/B testing provides objective data:
- Which variant produces more accurate results?
- Does adding examples improve quality?
- Is a longer prompt worth the extra cost?
Risk Mitigation
Test changes in controlled experiments before deploying to production. Catch regressions early and rollback safely.
Cost Optimization
Experiments reveal whether expensive models (GPT-4) outperform cheaper alternatives (GPT-3.5) for specific tasks. Optimize for cost/quality tradeoff.
Continuous Improvement
Run iterative experiments to refine prompts over time. Each experiment builds on previous learnings.
Core Concepts
Variants
Each experiment tests 2-5 variants of the same prompt:
- Variant A (Control) — Current production version
- Variant B (Treatment) — Modified version with one change
- Variant C+ — Additional treatments (optional)
Example variants:
Variant A (Control):
"Summarize the following article."

Variant B (Add examples):
"Summarize the following article. Example: [article] → [summary]"

Variant C (Change tone):
"Provide a concise summary of the article below, focusing on key facts."
Change only one variable per experiment. Testing multiple changes simultaneously makes it impossible to identify which change caused the performance difference.
Traffic Split
Allocate request percentages to each variant:
- 50/50 split — Standard A/B test (2 variants)
- 33/33/34 split — Three-way test
- 80/20 split — Cautious test (small treatment group)
Requests are randomly assigned to variants based on configured percentages.
Metrics
M3 Forge tracks both automatic and custom metrics:
Automatic metrics:
- Response latency (ms)
- Token count (input + output)
- Cost per request ($)
- Success rate (% non-error responses)
Custom metrics:
Define quality scores using evaluation functions:
// Example: Measure summary quality
function evaluateQuality(response: string): number {
  const hasClearStructure = /^(Summary|Key Points):/i.test(response);
  const appropriateLength = response.length >= 50 && response.length <= 500;
  const factualTone = !/(I think|maybe|probably)/i.test(response);

  let score = 0;
  if (hasClearStructure) score += 33;
  if (appropriateLength) score += 33;
  if (factualTone) score += 34;

  return score; // 0-100
}
Sample Size and Significance
Experiments run until reaching statistical significance or the configured sample size:
- Minimum sample size — At least 30 requests per variant (recommended 100+)
- Confidence level — 95% confidence interval (p < 0.05)
- Winning threshold — Variant must outperform control by at least 5%
M3 Forge calculates statistical significance automatically and highlights winning variants.
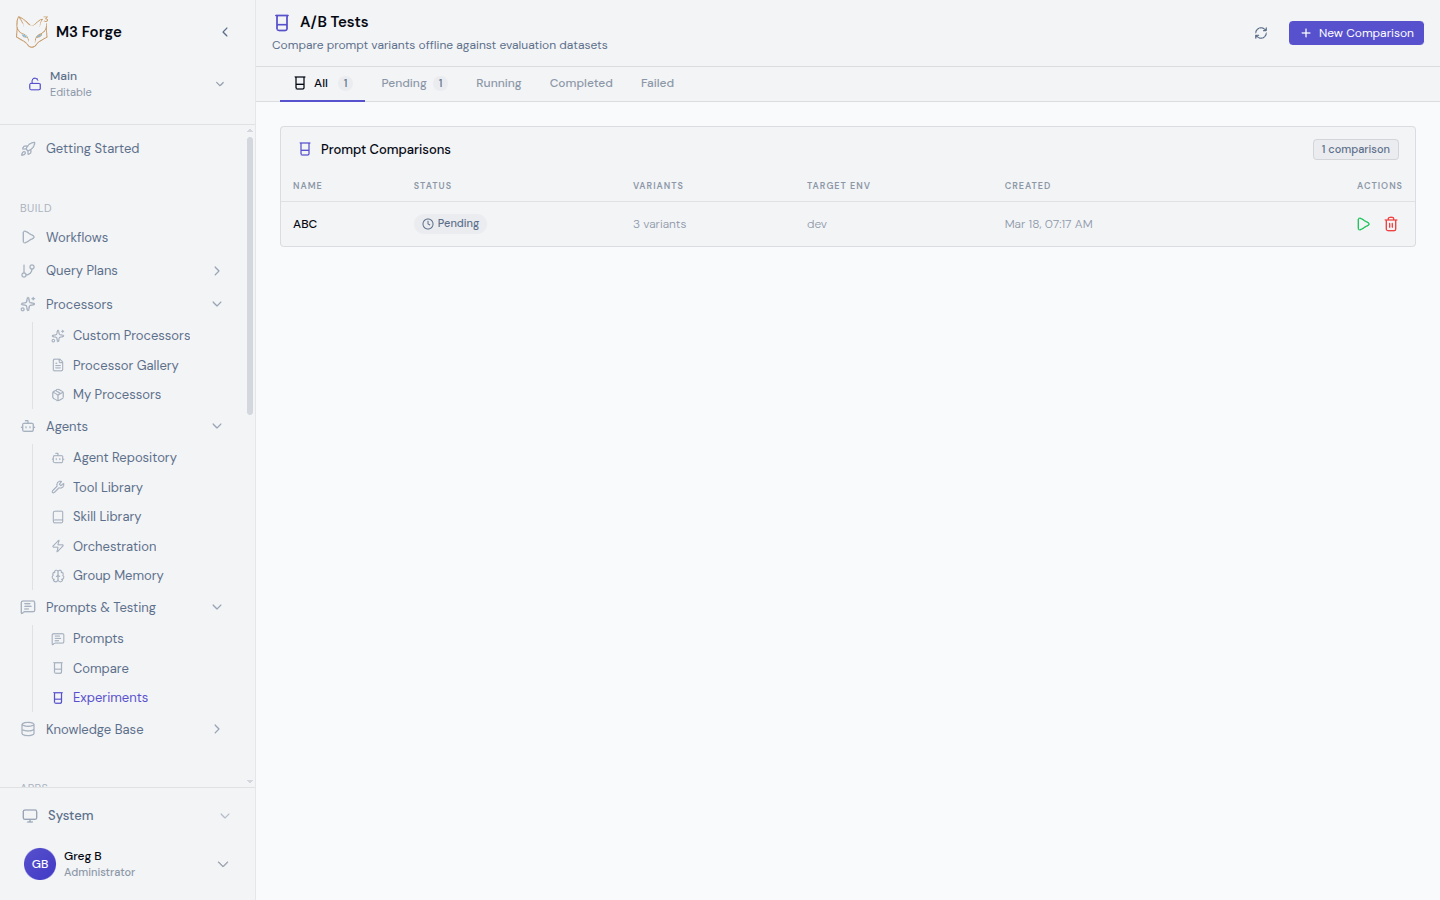
Creating an Experiment
Navigate to Experiments
Click “Experiments” in the top navigation or go to /ab-tests.
Create New Experiment
Click “New A/B Test”. The wizard opens in a side panel.
Configure Basic Settings
- Name — Descriptive name (e.g., “Add examples to summarization prompt”)
- Description — What you’re testing and why
- Prompt — Select the base prompt from your repository
- Duration — How long to run (or use sample size limit)
Define Variants
Add 2-5 variants:
- Click “Add Variant”
- Enter variant name (A, B, C or descriptive names)
- Paste or edit the prompt text
- Optionally change model or parameters per variant
Variant comparison tip: The wizard shows a diff view comparing each variant to the control.
Set Traffic Split
Allocate percentages:
- Equal split (50/50, 33/33/34) for unbiased testing
- Weighted split (80/20) to minimize risk of poor treatment affecting production
Configure Metrics
Select which metrics to track:
- Latency — Response time
- Cost — API cost per request
- Quality — Custom evaluation function
- Accuracy — Correctness score (requires ground truth data)
Launch Experiment
Click “Launch”. The experiment starts routing traffic according to configured splits.
Monitoring Experiments
Real-Time Dashboard
The experiment detail page shows live metrics:
- Requests per variant — Traffic distribution
- Win rate — Which variant is currently leading
- Statistical confidence — Progress toward significance
- Cost comparison — Total spend per variant
Performance Charts
Visualizations include:
- Response time distribution (box plots)
- Quality score trends (line charts)
- Cost efficiency (scatter plots)
- Success rate (bar charts)
Early Stopping
If one variant performs significantly worse, M3 Forge suggests early termination to avoid wasting budget on a losing variant.
Don’t stop experiments too early. Statistical significance requires adequate sample size. M3 Forge warns if you terminate before reaching 95% confidence.
Analyzing Results
Statistical Summary
Once the experiment completes, view the analysis page:
| Variant | Requests | Avg Quality | Avg Latency | Avg Cost | Win Rate |
|---|---|---|---|---|---|
| A (Control) | 523 | 78.3 | 1,234ms | $0.012 | 42% |
| B (Treatment) | 511 | 84.7 | 1,189ms | $0.015 | 58% |
Interpretation:
- Variant B has higher quality (84.7 vs 78.3)
- Variant B is slightly faster (1,189ms vs 1,234ms)
- Variant B costs more ($0.015 vs $0.012)
- Variant B wins 58% of comparisons
Recommendation: Deploy Variant B if the 25% cost increase is acceptable for 8% quality improvement.
Confidence Intervals
M3 Forge calculates 95% confidence intervals for all metrics:
- Quality: 84.7 ± 2.1 (82.6 to 86.8)
- Latency: 1,189ms ± 45ms
If confidence intervals overlap, the difference may not be statistically significant.
Export Results
Download experiment data as:
- CSV — Raw metrics for external analysis
- JSON — Programmatic access
- PDF Report — Executive summary with charts
Deploying Winners
One-Click Deployment
From the experiment results page:
- Click “Deploy Winner”
- Select deployment target (branch or production)
- Confirm deployment
The winning variant replaces the current prompt in the selected environment.
Gradual Rollout
For high-risk changes, deploy gradually:
- Start at 10% traffic to the new variant
- Monitor for 24 hours
- Increase to 50% if metrics remain stable
- Full rollout at 100%
M3 Forge automates gradual rollout with configurable thresholds.
Rollback Safety
If deployed variant underperforms:
- Click “Rollback” in the deployment panel
- Traffic instantly reverts to previous version
- Investigate why experiment results didn’t match production
Always run experiments with production-like traffic. Differences in user behavior between test and production environments can invalidate results.
Advanced Experiment Types
Multi-Objective Optimization
Optimize for multiple metrics simultaneously:
- Maximize quality AND minimize cost
- Maximize throughput AND maintain accuracy above 90%
Define weighted objectives:
Score = (0.6 × quality) + (0.3 × speed) - (0.1 × cost)The variant with the highest combined score wins.
Contextual Bandits
Instead of fixed traffic splits, use adaptive allocation:
- Start with equal traffic (50/50)
- As data accumulates, shift traffic toward the winning variant
- Minimize regret (requests sent to losing variants)
M3 Forge’s bandit algorithm dynamically adjusts splits based on real-time performance.
Sequential Testing
Run a series of experiments:
- Experiment 1: Test adding examples (A vs B)
- Deploy winner (B)
- Experiment 2: Test temperature changes (B vs C)
- Deploy winner (C)
Each experiment builds on the previous winner, compounding improvements.
Best Practices
Hypothesis-Driven Testing
Define a hypothesis before each experiment:
- “Adding examples will improve accuracy by 10%”
- “Shorter prompts will reduce latency without affecting quality”
Clear hypotheses guide variant design and metric selection.
Isolate Variables
Change only one element per experiment:
- Don’t test “add examples + change temperature” simultaneously
- Run separate experiments for each change
Adequate Sample Size
Use at least 100 requests per variant. Underpowered experiments produce unreliable results.
Control for External Factors
Run experiments during similar time periods to avoid confounding variables (e.g., weekend vs. weekday traffic).
Document Learnings
Record experiment insights for future reference:
- Which changes worked and why
- Which assumptions were wrong
- Recommendations for future tests
Failed experiments are valuable. Learning that a change doesn’t help prevents wasted effort implementing it in other prompts.
Common Experiment Scenarios
Prompt Length
Hypothesis: Shorter prompts reduce cost without sacrificing quality.
Variants:
- A: 500-token prompt with detailed instructions
- B: 200-token prompt with concise instructions
Metrics: Quality score, cost per request
Examples vs. No Examples
Hypothesis: Few-shot examples improve accuracy.
Variants:
- A: Zero-shot (instructions only)
- B: Few-shot (3 examples included)
Metrics: Accuracy, latency
Model Selection
Hypothesis: GPT-3.5 is sufficient for this task (cheaper than GPT-4).
Variants:
- A: GPT-4 Turbo
- B: GPT-3.5 Turbo
Metrics: Quality score, cost per request
Temperature Tuning
Hypothesis: Lower temperature improves consistency.
Variants:
- A: Temperature 0.7
- B: Temperature 0.2
Metrics: Quality consistency (standard deviation), average quality
Next Steps
- Test variants in Playground before running experiments
- Compare variants visually to understand differences
- Deploy optimized prompts to production workflows